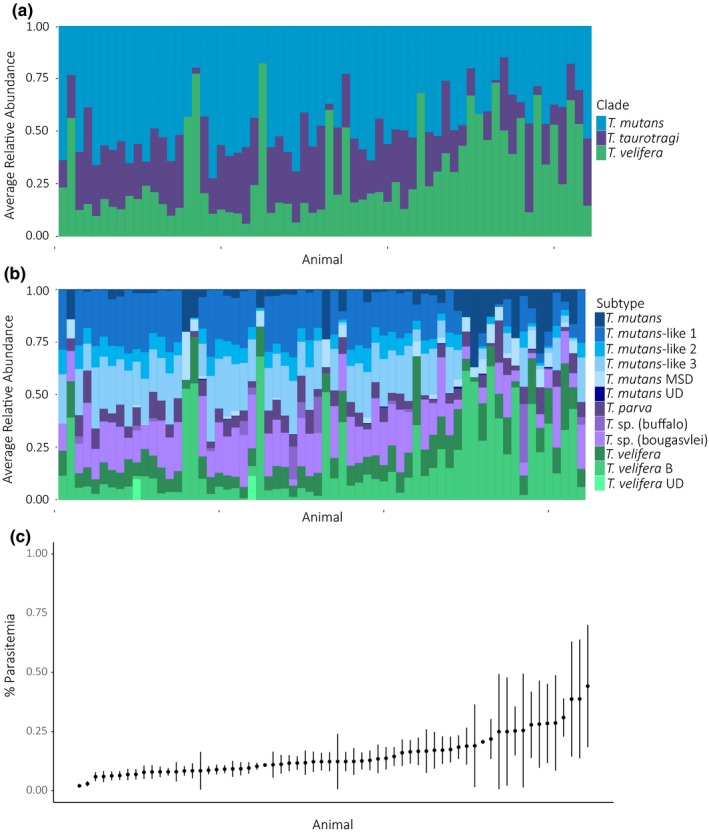
Figure 5.

Parasitemia and variation in community composition at an individual level. (a) Averaged clade community composition for each animal. (b) Averaged subtype community composition. (c) Percent parasitemia (mean and SE) for each animal. The y‐axis extends from 0% to 1% (not 100%). Each figure is ordered from the animal with the lowest mean % parasitemia to the highest % parasitemia
