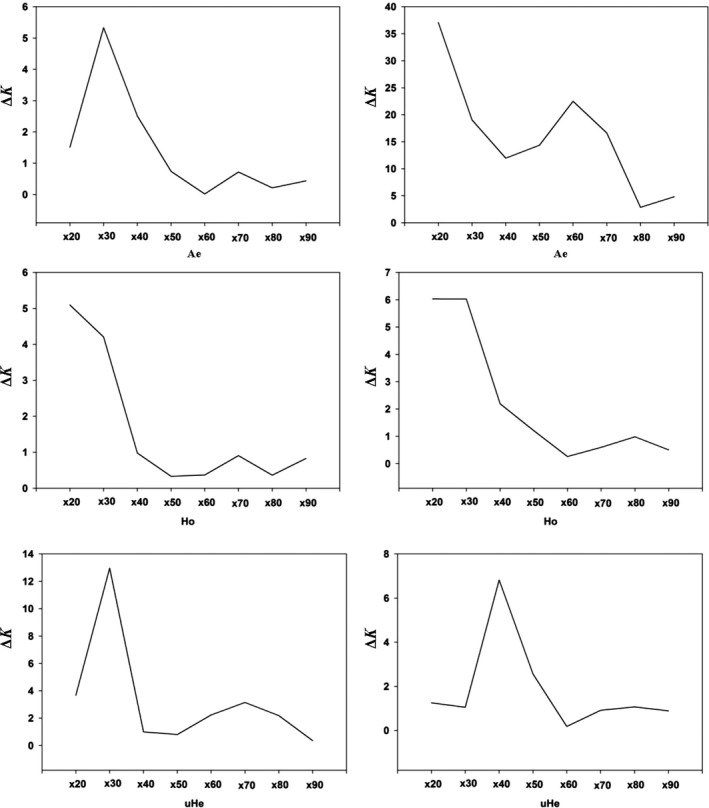
Figure 3.

Line charts showing the minimum number of resampling replicates (x) needed to obtain accurate estimates of genetic diversity for populations of Bemisia tabaci (USA0601 and ISQ), the line charts on the left and right represent the results of USA0601 and ISQ separately. The ΔK (y‐axis) showed a peak at the optimal replicates (x). A e, number of effective alleles; H o, observed heterozygosity; uH e, unbiased expected heterozygosity
