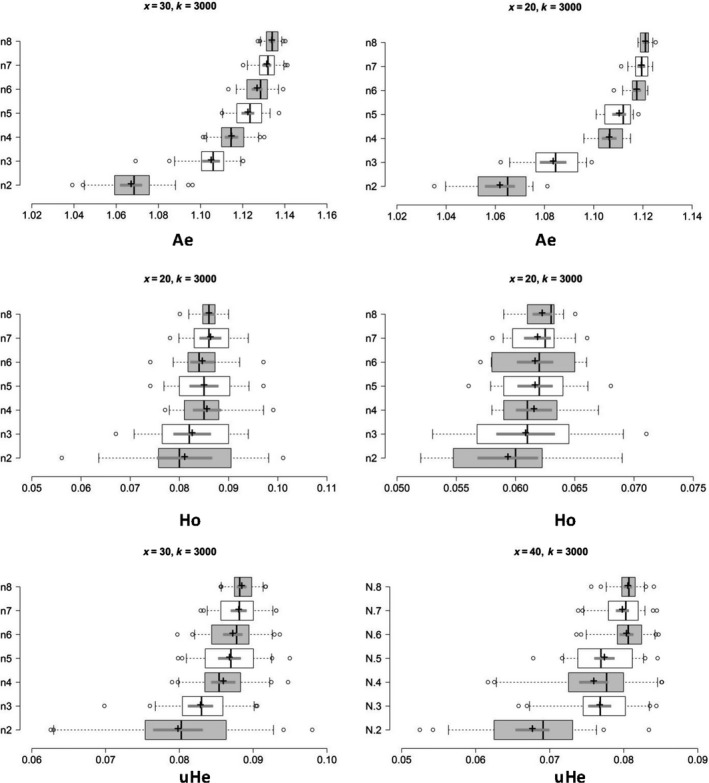
Figure 4.

Based on the optimal replicates (x) for populations of Bemisia tabaci, boxplots showing the minimum number of sample sizes (n) needed to obtain accurate estimates of genetic diversity for populations of Bemisia tabaci (USA0601 and ISQ), the boxplots on the left and right represent the results of USA0601 and ISQ separately. Center lines show the medians; box limits indicate the 25th and 75th percentiles; whiskers extend 1.5 times the interquartile range from the 25th and 75th percentiles; outliers are represented by dots; crosses represent sample means; bars indicate 95% confidence intervals of the means. n is the sample size. A e, number of effective alleles; H o, observed heterozygosity; uH e, unbiased expected heterozygosity
