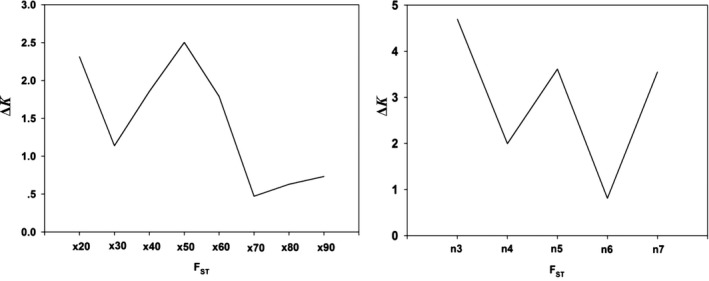
Figure 7.

Line charts showing the optimal replicates (left) and minimum number of sample sizes (right) needed to obtain accurate estimates of F ST between populations of Bemisia tabaci (USA0601 and ISQ). The ΔK (y‐axis) showed a peak at the optimal replicates and sample sizes. x, resampling replicates; n, sample sizes
