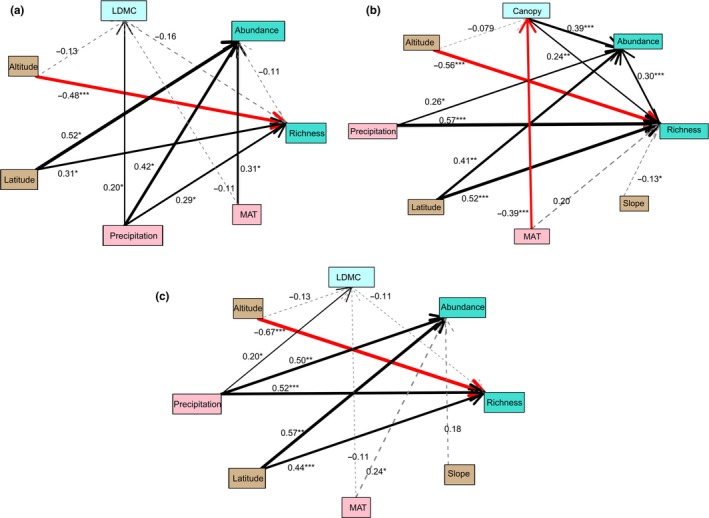
Figure 2.

Fitted multigroup structural equation model (SEM) depicting the effects of environmental and biological variables on species richness. Single‐headed arrows represent causal relationships. Numbers on arrows and width of arrows correspond to standardized path strength. A variable lacking a significant relationship with other variables in the model is presented in gray. (a) Shrubs, (b) trees, and (c) plant community
