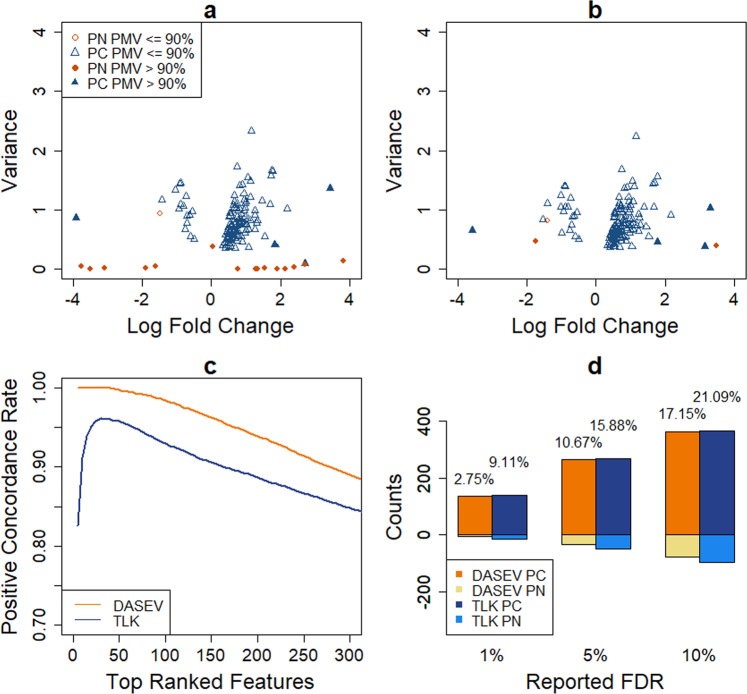
Figure 5.
Comparison of DASEV and TLK based on subsampling 100 observations per group from the human urinary proteome dataset. Panel a and b are estimated log fold change versus variance for TLK and DASEV, respectively. Panel c shows the positive concordance rate between the subsample and full dataset. Panel d shows numbers of positive concordance (PC) and positive non-concordance (PN) features based on the subsample analysis for a reported FDR threshold of 1%, 5% or 10%. The percentage shown on top of a bar is the observed positive non-concordance rate. For panels a and b, results were based on a single subsample. For panels c and d, results were averaged across 100 subsamples.

