
Figure 6.
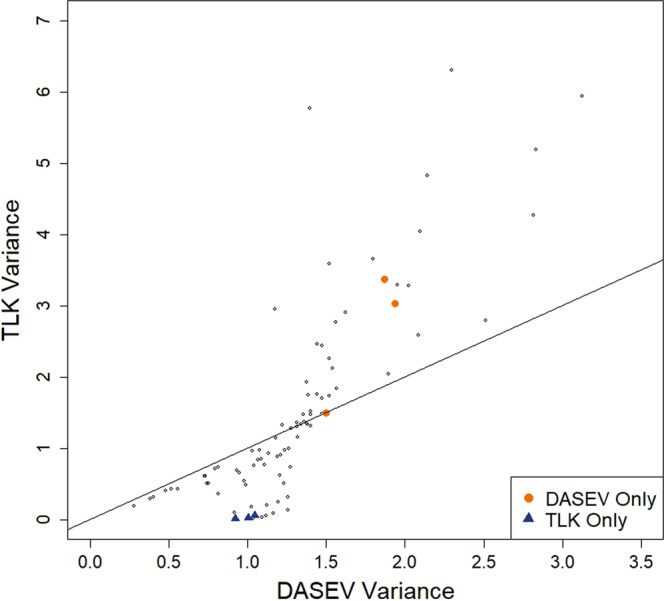
Comparison of Non-small cell lung cancer exosomal lipids data analysis results between DASEV and TLK. Estimated variances from these two methods are plotted against each other for the 101 lipid features. The solid line indicates where the two estimates are equal. Orange dots indicate the three differentially abundant features only identified by DASEV and blue triangles indicate the three differentially abundant features only identified by TLK.