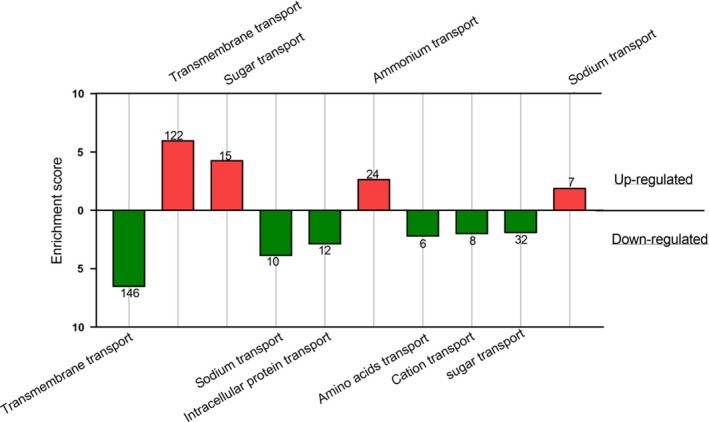
Figure 3.

Enriched transport‐related Gene Ontologies (GO) for differentially expressed genes of in hospite symbionts comparing to free‐living algae. Clusters of GO categories are presented for up‐regulated (red) and down‐regulated (green) genes and plotted against a calculated enrichment score. See Table S3 for details of the GOs categorizes within each group. The number of genes in each group is indicated on the column
