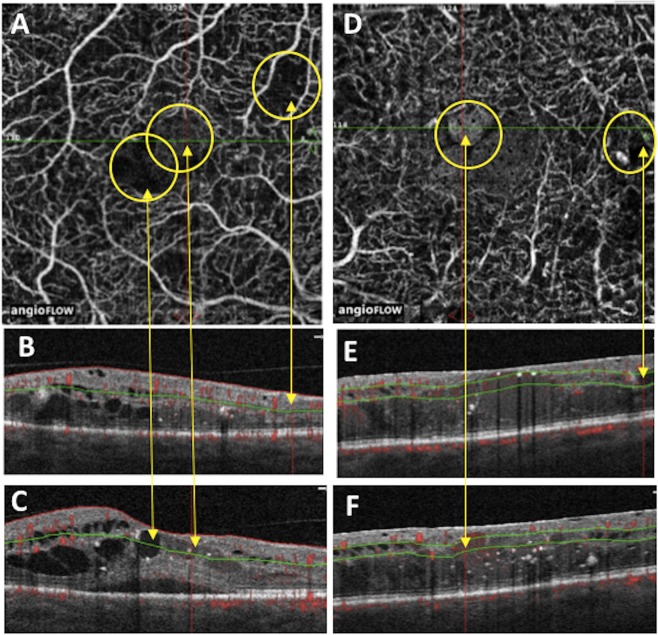
Figure 1.
ROIs in SCP and DCP imaged by AngioVue. In (A) SCP scans with visualization of 3 ROIs (yellow circles): the rightmost hyporeflective ROI (rightmost yellow circle) that corresponded to NPA on structural B-scan OCT (visualized in (B) pointed out by yellow arrow), the middle hyperreflective ROI (middle yellow circle) that corresponded to cyst on structural-scan OCT (visualized in (C) pointed out by yellow arrow), the leftmost hyporeflective ROI (leftmost yellow circle) that corresponded to cyst on structural B-scan OCT (visualized in (C) pointed out by yellow arrow). In (D) DCP of 2 ROIs (yellow circles): the rightmost hyporeflective ROI (rightmost yellow circle) that corresponded to cyst on structural B-scan OCT (visualized in (E) pointed out by yellow arrow), the leftmost hyperreflective ROI (leftmost yellow circle) that corresponded to cyst on structural-scan OCT (visualized in F, pointed out by yellow arrow).

