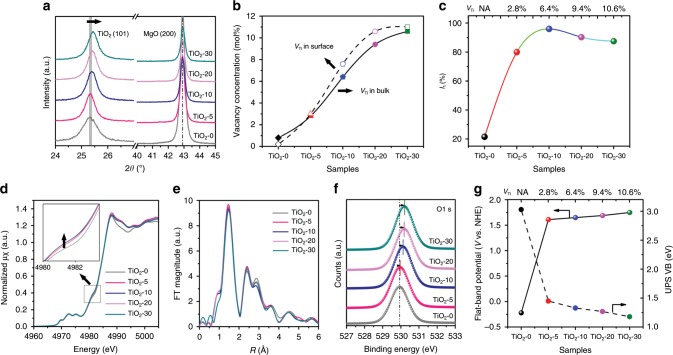
Fig. 2. Defect characterizations of metal-defected TiO2.
a Enlarged XRD patterns (with 2θ in the range of 24°–45°); b Vacancy concentration of TiO2 in bulk and surface (determined by chemical titration and XPS analysis, respectively); c Intensity of monovacancies from positron annihilation lifetime spectra (PALS), in which I1 is the relative intensity of τ1 (metal monovacancies); d X-ray absorption near edge structure (XANES) and e Fourier transforms of k-space oscillations of Ti K edge; f high-resolution O1s XPS spectra (fitted); g The positions of flat-band potential and UV-photoelectron spectroscopy (UPS) VB (valance band) binding energy.

