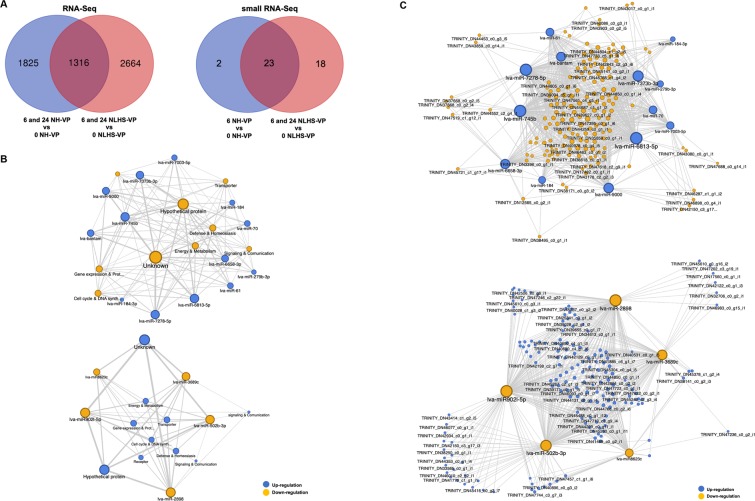
Figure 6.
Network analysis for miRNA/mRNA interaction. (A) The Venn diagrams represent number of unique and common L. vannamei mRNAs and miRNAs that are expressed in response to VPAHPND infection and following the NLHS and NH treatments. The differentially expressed genes (DEGs) and miRNAs (DEMs) were identified based on RNA-Seq data and small RNA-Seq data, respectively. The number of DEGs or DEMs identified through the normalization of genes or miRNAs expressed by L. vannamei hemocytes infected with VPAHPND (NLHS-VP) at 6 and 24 hpi (6 NLHS-VP and 24 NLHS-VP) to that of 0 hpi (0 NLHS-VP) is shown in the red circle. The blue circle represents the number of DEGs or DEMs derived from VPAHPND-infected L. vannamei hemocyte controls (NH-VP) at 6 and 24 hpi (6 NH-VP and 24 NH-VP) with that of 0 hpi (0 NH-VP). (B) The miRNA/mRNA negative correlation network based on the predicted miRNA target function. The upper panel is the miRNA/mRNA network of up-regulated miRNAs (blue circle) and down-regulated genes (yellow circle), whereas the lower panel is the miRNA/mRNA network of down-regulated miRNAs (yellow circle) and up-regulated genes (blue circle). (C) The miRNA/mRNA negative correlation network of selected unique isotigs. The upper panel is the miRNA/mRNA network of up-regulated miRNAs (blue circle) and down-regulated genes (yellow circle), whereas the lower panel is the miRNA/mRNA network of down-regulated miRNAs (yellow circle) and up-regulated genes (blue circle). The circular nodes represent mRNAs and miRNAs. The degree of connectivity, which represents the number of genes regulated by a given miRNA, is indicated by the size of the node.

