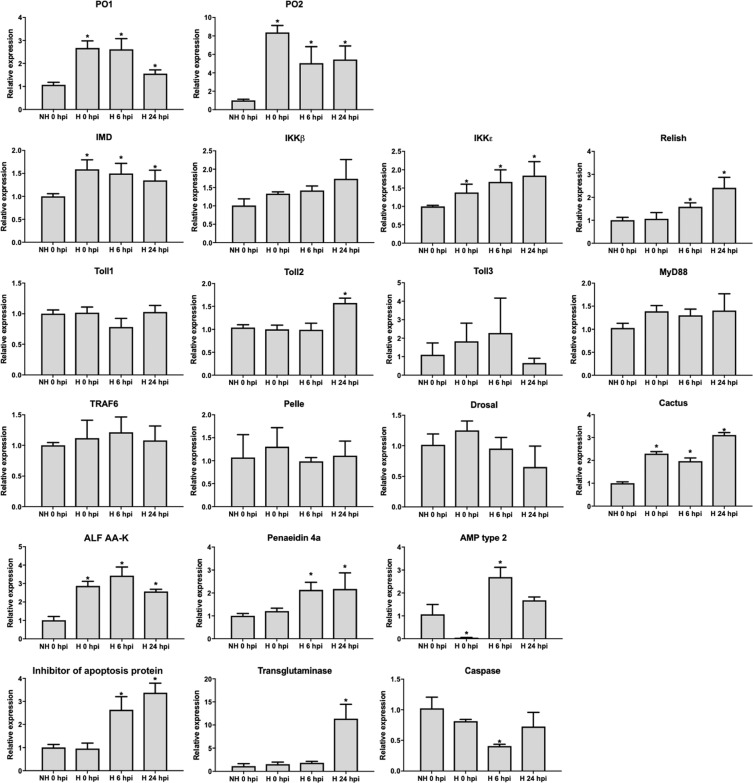
Figure 7.
Relative expression analysis of genes in the NLHS-VP modulated immune pathways. Expression level of genes in the prophenoloxidase system (PO1 and PO2), IMD pathway (IMD, IKKε, IKKβ, and Relish), Toll pathway (Toll1, Toll2, Toll3, MyD88, TRAF6, Pelle, Drosal, and Cactus), antimicrobial peptide (ALF AA-K, Penaedin 4a, and AMP type 2), and hemocyte homeostasis (TGase and Inhibitor of apoptosis protein) was determined by RT-qPCR in the hemocytes of VPAHPND-challenged L. vannamei at 0 hpi (NH 0 hpi) and of NLHS-treated L. vannamei challenged with VPAHPND at 0 hpi (H 0 hpi), 6 hpi (H 6 hpi), and 24 hpi (H 24 hpi). Relative expression ratios are calculated using EF-1α as the internal control. Relative expression level of each gene in hemocytes of NLHS-treated L. vannamei challenged with VPAHPND at each time point after infection was normalized to that of NH 0 hpi to determine the effect of both NLHS and VPAHPND challenge. The results were derived from triplicate experiments. Asterisks indicate significant differences at P < 0.05 from the NH 0 hpi. The expression profile of PO1 and PO2 under the NLHS condition was modified and re-presented from Fig. 4.

