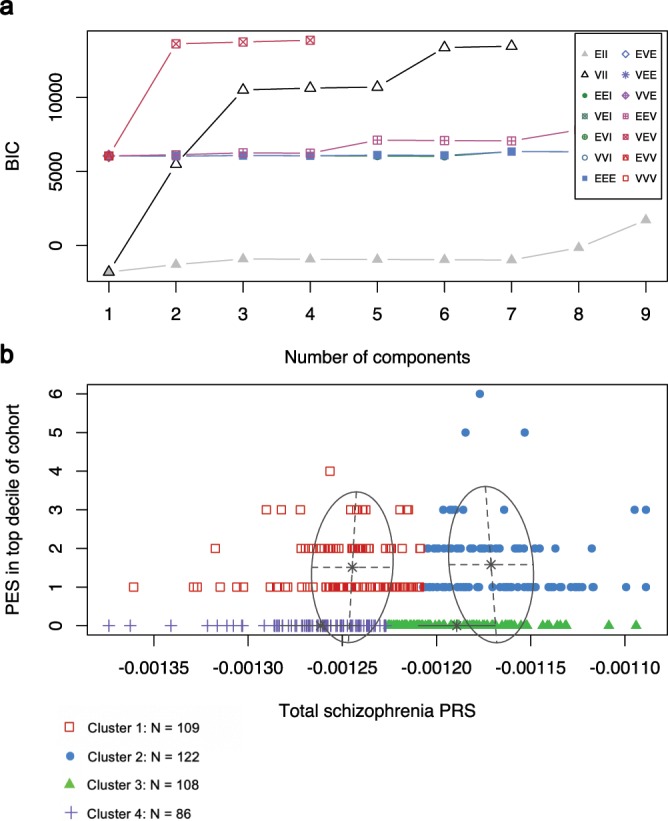
Figure 2.

Clustering of genome wide PRS and the individual count of elevated pharmagenic enrichment score using finite Gaussian mixture modelling. (a) Selection of the number of clusters using the Bayesian information criterion (BIC). The scale represents the fourteen different Gaussian models (see Supplementary Table 5 for definitions) tested for parametrisation of the within-group covariance matrix. (b) Derived clusters of genome wide schizophrenia PRS (Total PRS) and the number of PES in the top decile of the ASRB cohort per individual. Red boxes = Cluster 1, blue circles = Cluster 2, green triangles = Cluster 3, purple crosses = Cluster 4.
