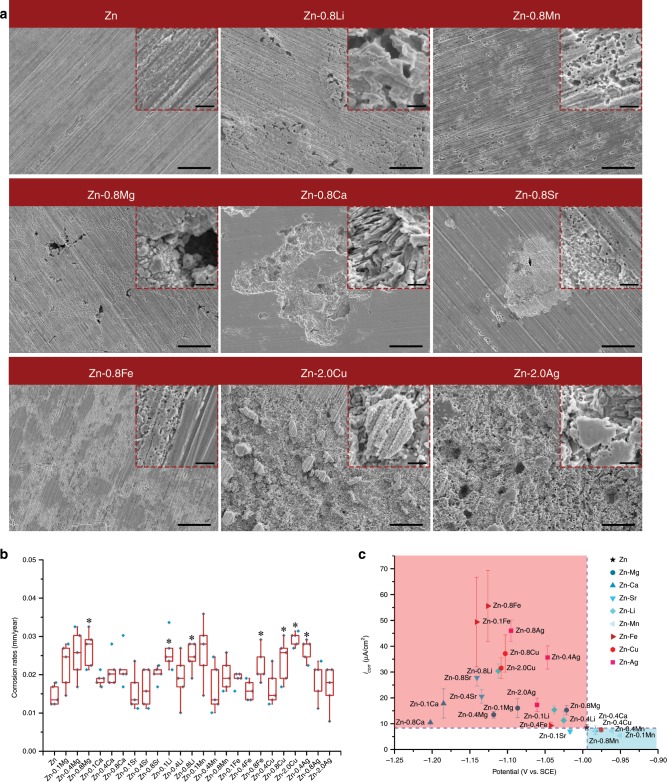
Fig. 3. In vitro corrosion behavior of pure Zn and binary Zn alloys.
a Corrosion morphology of selected materials after removal of corrosion products, intermetallic phases are marked by white arrows. Scale bar, 20 μm in low magnification, 2 μm in the inserts. b Corrosion rates calculated on weight loss (n = 5, independent samples). *P < 0.05 by one-way ANOVA with Tukey’s post hoc test, compared with pure Zn. For box-whisker plots, box edges correspond to 25th and 75th percentiles, lines inside the box correspond to 50th percentiles, and whiskers include minimum and maximum of all data points. c Corrosion current density verses corrosion potential based on results of electrochemical test. Error bars indicate mean ± standard deviation (n = 3, independent samples). Source data are provided as a Source Data file.

