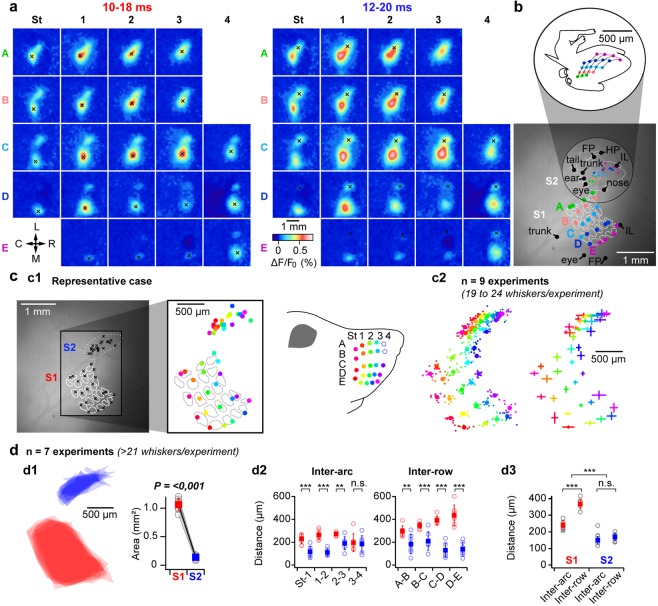
Figure 2.
Functional mapping of whiskers representation in S1 and S2. (a) Functional mapping of the representation of 22 whiskers in S1 and S2 was performed by analyzing VSD images of early cortical responses to single whisker deflections (as illustrated for C2 of the same animal in Fig. 1: n = 3 highest response amplitude trials over 10), local maxima indicated by black crosses are used as proxy for the center of functional representations in S1 and S2 (note that the S2 representation of A3 is not shown as it could not be distinguished from its S1 representation). L: lateral, M: medial, R: rostral, C: caudal. (b) For the same animal, responses to tactile stimuli delivered to different parts of the body (inferior lip [IL], eye, ear, trunk, tail, forepaw [FP], hind paw [HP], were also recorded. Local maxima extracted from early signals are shown together with the whisker representations in S1 and S2, over the reference fluorescent image (bottom, white dashed lines outline the contours of the S1 layer 4 barrels) allowing the reconstruction of a S2 “mousunculus” (white solid line). Top: Sketch of the S2 mousunculus (c) The functional mapping of whiskers representation reveals a clear somatotopy within S2. c1: same experiment than in a, the center of the functional representations of the 22 whiskers in S1 and S2 are shown on the reference fluorescence image (left). To better visualize the functional mapping, the identity of the whiskers has been color-coded (right, note the absence of A4 and B4 for this animal). c2: Data presented for 9 similar experiments (n = 19 to 24 whiskers per experiment) and realigned relative to the S1 and S2 centroids, respectively (centroids calculated over the 18 whiskers that are common to all the experiments). Left: individual maps (small dots) together with averaged map (filled circles). Right: Averaged map +/− standard deviations. (d) Comparison of S2 versus S1 functional maps (n = 7 mice with ≥21 whiskers). d1: Superimposition of S1 (red) and S2 (blue) areas determined by joining the locations corresponding to the most external whiskers (excluding A3, A4, B4) with the corresponding quantification (right, Paired t-test comparison). d2: Quantification of individual inter-row and inter-arc distances. d3: Averaged inter-row and inter-arc comparison. n.s.: non-significant **p < 0.01, ***p < 0.001 (two way repeated measures analysis of variance, Holm-Sidak multiple comparison).

