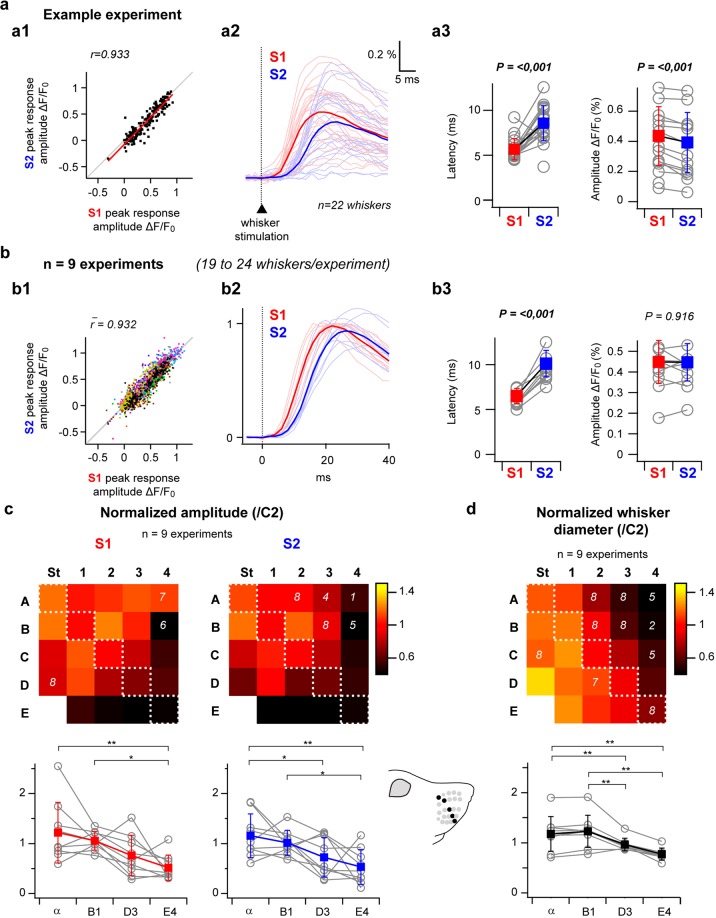
Figure 3.
Comparison of whisker-evoked responses in S2 versus S1. (a) Whisker-evoked responses in S2 versus S1 for a single example experiment (same as in Figs. 1 and 2). a1: Single trial response amplitudes in S2 plotted as a function of responses amplitudes measured in S1 (n = 22 whiskers × 10 trials) demonstrate a close to linear relationship. a2: Averaged fluorescence profiles showing responses to each individual whisker (faint colors), together with all-whiskers averages (bright colors). a3: S2 versus S1 comparison of responses latencies (quantified by extrapolation of a linear 20–80% fit of the rising phase of the signal) and amplitudes, grey open circles show averaged values for individual whiskers over n = 10 trials, filled red and blue squares show all-whiskers averages +/− standard deviations in S1 and S2, respectively. (b) Same analyses applied to the population (n = 9 experiments). In b1, each color represents an individual experiment; b2, all-whiskers averages are shown for each experiment after normalization by the peak of S1 response. In b3, only all-whisker averages are shown as grey open circles for each experiment, filled squares show averages across the 9 experiments (+/− standard deviation). (c) Top: S1 and S2 whisker maps illustrating the amplitudes of averaged whisker-evoked responses normalized by the C2-evoked response amplitude (n = 9 experiments, n = 10 trials per whisker, white numbers on the maps indicate lower n values for some whiskers due to either absent whisker or impossible determination of the corresponding cortical representation location). These maps reveal both in S1 and S2 a gradient of response intensities throughout the barrel map. Bottom: comparison of the amplitudes along a diagonal of the whisker map reveals significant gradually decreasing responses from α to E4. (d) Top: whisker diameters measured at the skin-insertion level and normalized by the C2 whisker diameter (n = 9 mice, white numbers indicate lower n values for some whiskers that were either absent or lost during the experimental procedure). Although they also gradually decrease from α to E4, the overall gradient of whiskers diameter seems to present an orthogonal axis relative to the response amplitude maps. *p < 0.05, **p < 0.01 (Friedman repeated measures analysis of variance on ranks or one way repeated measures analysis of variance, Tukey Test multiple comparison).

