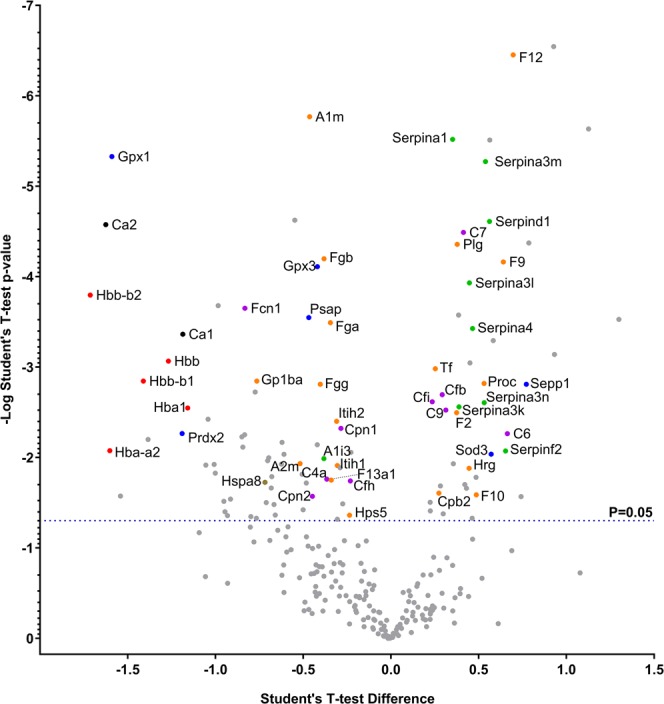
Figure 8.

Proteomic Analysis. Effect of CS treatment on AFB1 (1.0 mg/kg)-induced changes in circulating protein abundance at 5.5 hours (n = 8). Key proteins that were significantly different between Control and CS treatment (P < 0.05) are color coded by function: red, hemoglobin; black, pH and fluid homeostasis; orange, coagulation; purple, complement; green, protease inhibitor; blue, ROS detoxification; brown, heat shock. Mean difference (Control-CS) vs. statistical P-value at 5.5 h post-toxin dose following 4 hours of hemoperfusion.
