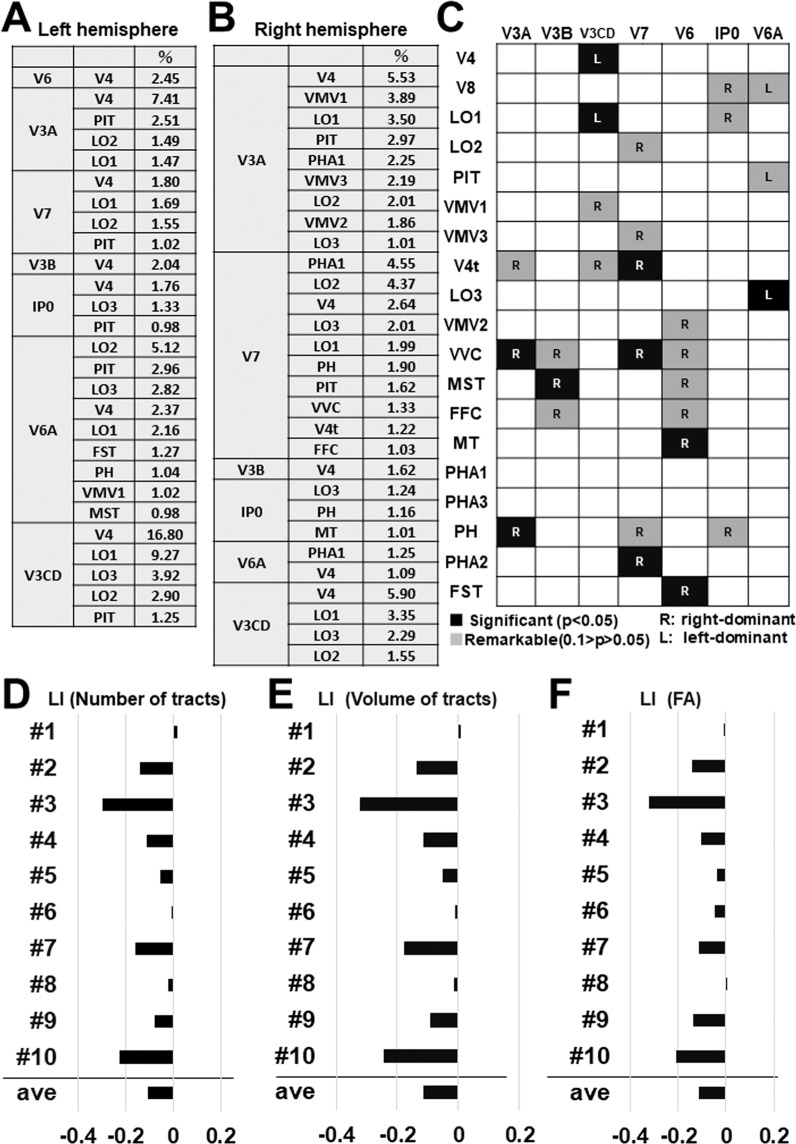
Figure 8.
Ratio and laterality for the number, the volume, and the FA of VOF’s fiber tracts. (A,B) The table indicates the ratio (%) for the number of tracts to connect each combination of the cortical area in left and right hemisphere, respectively. The data is the average of 10 subjects. (C) The laterality for the number of tracts to connect each combination of the cortical area. The data is the average of 10 subjects. Darker colors indicate the strength of connection. R; right-ward lateralization, L; left-ward lateralization. (D–F) Graphs indicate the laterality index (LI) for the total number (D), the total volume (E), and the total FA (fractional anisotropy) (F) of VOF’s fiber tracts in individual brains (subject #1–10).

