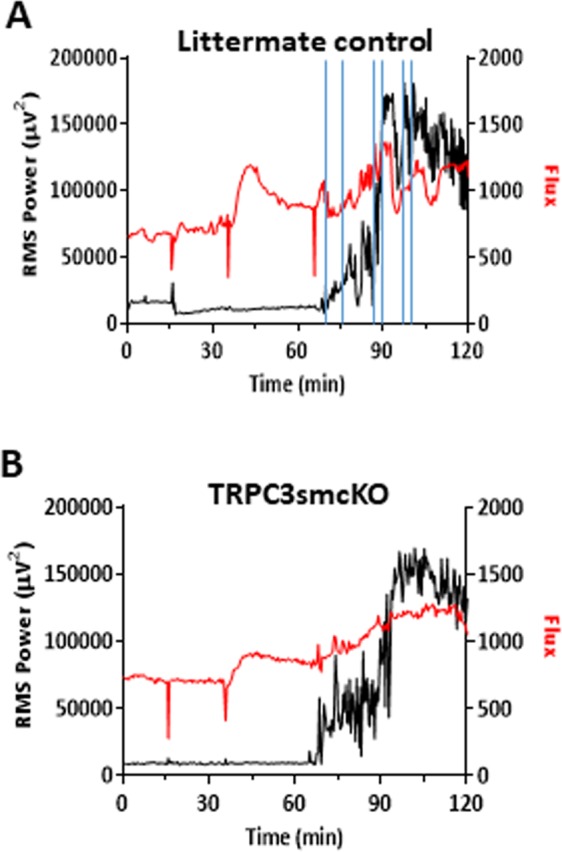
Figure 4.

Analysis of neurovascular coupling by LSI/EEG. (A) RMS power/flux overlay of representative data from a littermate control mouse demonstrating IHR after SE onset. Periods of IHR are denoted between vertical blue lines. (B) RMS/flux overlay of representative data from a TRPC3smcKO mouse showing more sustained blood flow with less variability during late SE. The three sharp dips in the flux data are artifacts corresponding to the sequential injection of methylscopolamine, pilocarpine and pentylenetetrazol (as described in Fig. 3 legend), when the camera view was briefly occluded by the experimenter’s hand administering the injection. The camera was intentionally blocked to provide a clear marker on the flux trace of injection times.
