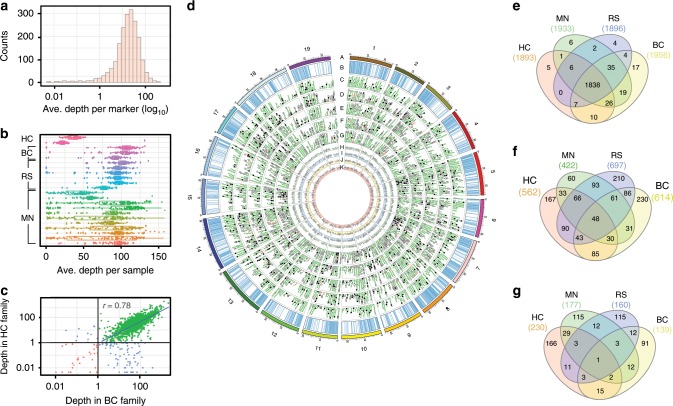
Fig. 3. Performance of 2,000 rhAmpSeq markers in four families.
a Distribution of average depth of markers on a log10 scale. b Average depth per sample in all plates of four families. Each point represents one sample in the plate. The bound box represents the 25th or 75th percentiles and the whiskers extends to 1.5 times of the interquartile range. c Correlation of read depth in two families. The Pearson correlation coefficient was calculated for the markers with average depth larger than one in both families. d Circos plot of marker performance in four families and the metapopulation. a denotes Chromosomes; b denotes physical locations of rhAmpSeq core genome markers; c–g denote rhAmpSeq markers that failed to return data (red triangle), distorted (black square), monomorphic (white square) and on linkage map (green circle) for consensus genetic map, HC, MN, BC and RS families; h–k denote read depth across for each marker in HC, MN, BC, RS families, respectively. e Venn diagram of the markers with average read coverage greater than 1 across the four families. f Venn diagram of the monomorphic markers in four families. g Venn diagram of the distorted markers in four families.

