Figure 1.

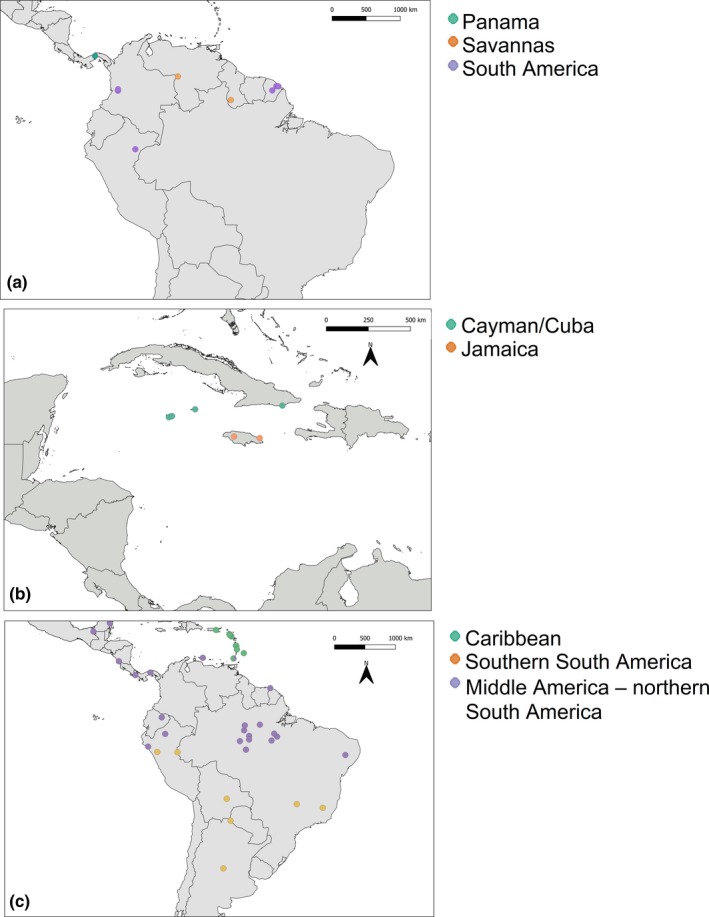
Maps of study areas and sampling location. (a) M. coibensis, (b) M. milleri, (c) M. molossus. Colors represent populations found in the structure and DAPC analyses

Maps of study areas and sampling location. (a) M. coibensis, (b) M. milleri, (c) M. molossus. Colors represent populations found in the structure and DAPC analyses