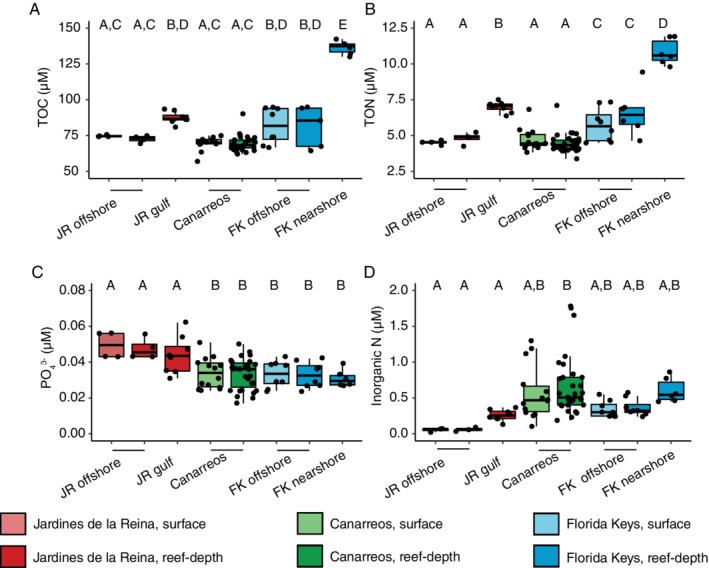
Figure 3.

A comparison of seawater organic matter and nutrient concentrations across the reefs shows differential concentrations between the reef‐systems. Measurements include (A) total organic carbon (TOC), (B) total organic nitrogen (TON), (C), phosphate (PO4 3−) and (D) inorganic nitrogen (NO2 − + NO3 − + NH4 +). Lower and upper edges of the boxplot correspond to the first and third quartiles, the whiskers extend to the largest or smallest value at 1.5 times the interquartile, and the black bar across the box represents the median. Boxplots with different letters denote concentrations that are significantly different from each other (ANOVA, Tukey's HSD test, p < 0.05) within each plot.
