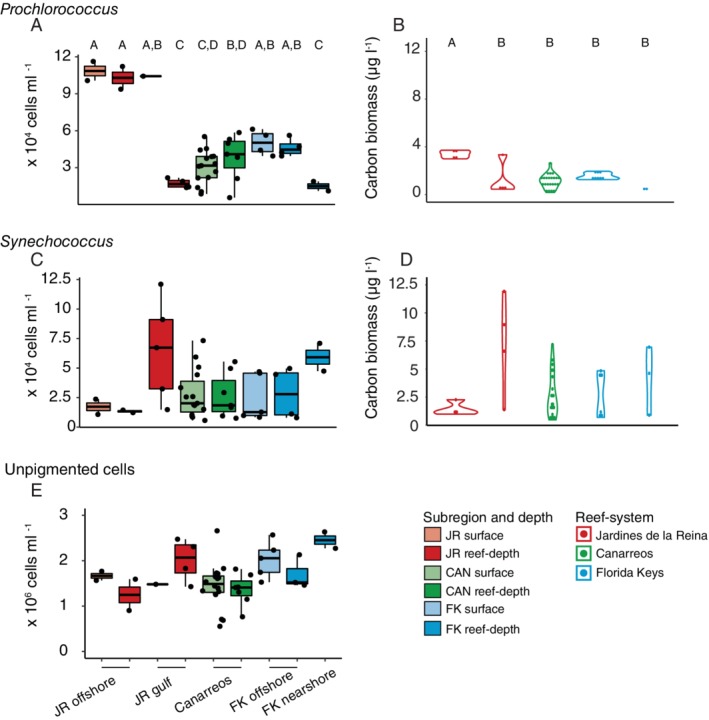
Figure 4.

Differential microbial abundances and the carbon contributions of these cells in seawater across different reef subregions for (A, B) Prochlorococcus and (C, D) Synechococcus. Unpigmented cell abundance (largely heterotrophic bacteria and archaea) are shown in (E). Lower and upper edges of the boxplot correspond to the first and third quartiles, the whiskers extend to the largest or smallest value at 1.5 times the interquartile, and the black bar across the box represents the median. Boxplots and violin plots with different letters are significantly different from each other (Kruskal–Wallis Rank Sum test and Conover–Iman or Dunn's tests, p < 0.05).
