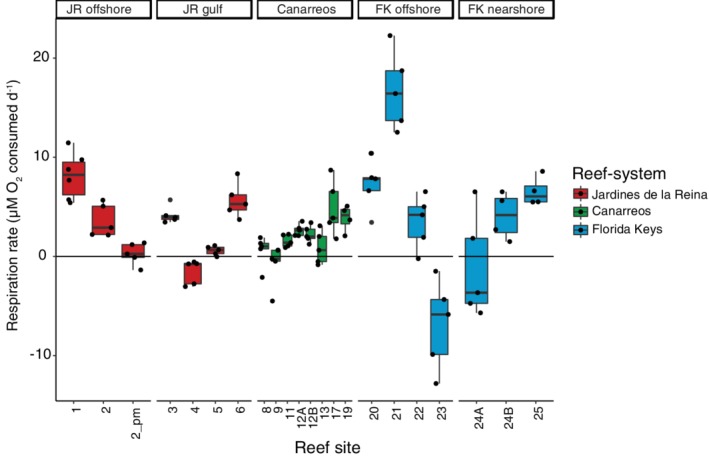
Figure 10.

Comparison of net community respiration rates for reef‐depth seawater across reef‐systems. Lower and upper edges of the boxplot correspond to the first and third quartiles, the whiskers extend to the largest or smallest value at 1.5 times the interquartile, and the black bar across the box represents the median. Reef sites with either an A or B after the number were sampled twice but on different days. All incubations were completed with reef seawater collected in the morning with the exception of one incubation at site JR 2 that was collected in the afternoon (labelled as ‘2_pm’).
