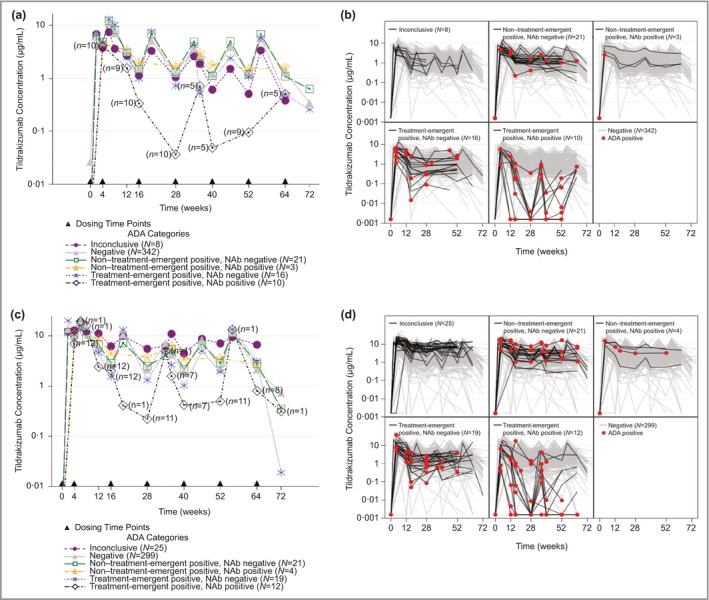
Figure 2.

Effect of antidrug antibodies (ADAs) on tildrakizumab (MK‐3222) concentrations for patients treated with 100 mg or 200 mg continuously for 52–64 weeks. (a) Mean concentration–time profiles for patients treated with 100 mg. (b) Individual concentration–time profiles for patients treated with 100 mg. (c) Mean concentration–time profiles for patients treated with 200 mg. (d) Individual concentration–time profiles for patients treated with 200 mg. For (a) and (c), dosing is represented by a solid triangle along the x‐axis. The numbers on the treatment‐emergent‐positive, neutralizing antibody (NAb)‐positive profile represent the number of patients contributing to that time point. For (b) and (d), grey lines represent the concentration–time profile in ADA‐negative patients. Red filled circles represent individual samples that tested positive for ADAs. Continuous treatment with tildrakizumab means that patients treated with placebo or etanercept and then tildrakizumab were not included in the analysis.
