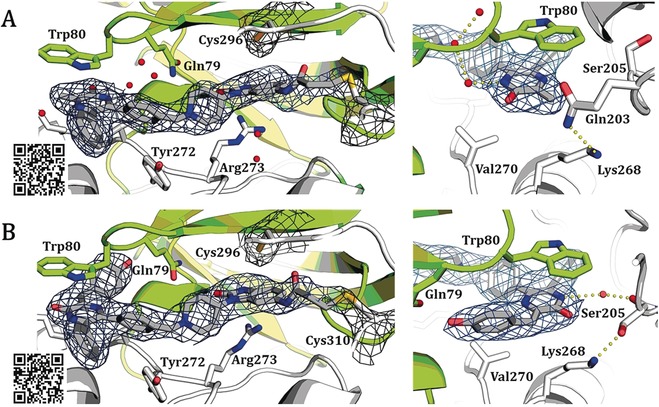
Figure 3.

Co‐crystal structures of full‐length Akt1 in complex with novel covalent‐allosteric inhibitors, 2FO−FC maps contoured at 0.8 σ. A) Co‐crystal structure of Akt1 with 16 a (PDB: 6S9W) and B) co‐crystal structure of Akt1 with 15 c (PDB: 6S9X). The electron density indicates possible covalent bond formation with both Cys 296 and Cys 310 but suggests preferred modification of Cys 310 (see mFo−DFc simulated annealing omit maps in Figure S4).
