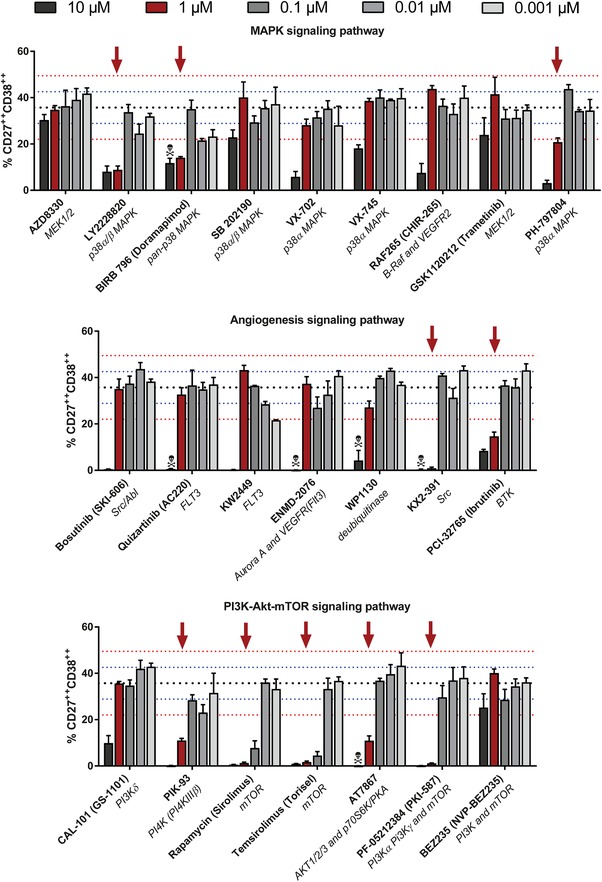
Figure 2.

Validation of plasmablast‐inhibiting compounds. Plasmablast‐inhibiting compounds of the initial screening were validated in multiple concentrations around the initial dose of 1 µM. Again, PBMCs were stimulated with CpG/IL‐2 for 6 days. Plasmablasts were gated as CD19+CD20dim/+CD27++CD38++. Shown are the MAPK, angiogenesis, and PI3K‐AKT‐mTOR signaling pathways. Pooled data (n = 3) from three independent experiments. Black dotted line: mean percentage of CD27++ CD38++ B cells after 6 days of CpG/IL‐2 stimulation without compound (n = 72). Blue dotted line: ±1 SD. Red dotted line: ±2 SD. Red arrow: percentage of CD27++CD38++ B cells below −2 SD of CpG/IL‐2 stimulated cells without compound at the concentration used in the initial screen (1 µM). Toxicity symbol: percentage of lymphocytes below −2 SD of CpG/IL‐2 stimulated cells without compound.
