

Conventional flow cytometry using fluorescent and scattering detection methods has been a fundamental tool of discoveries in cell biology and disease diagnosis for many years. However, invasive sampling of small blood volumes only (typically ≤10 ml) leads to missing rare biomarkers, especially at early disease stage. Assessment of larger blood volumes is possible in in vivo flow cytometry with fluorescent, photoacoustic (PA), and combined PA‐fluorescence detection of circulating biomarkers directly in the bloodstream of animals and recently humans 1, 2, 3, 4, 5. In particular, in vivo advanced multicolor PA flow cytometry (PAFC) with many innovations (e.g., high pulse rate multispectral lasers, linear beam shape, focused ultrasound transducers, nanobubble‐induced sensitivity amplification, skin pigmentation tolerant signal processing, and cell focusing in blood flow) demonstrated label‐free detection of circulating tumor cells (CTCs) in melanoma patients, malaria‐infected cells, bacteria at bacteremia, and sickled erythrocytes with ~1,000× improved sensitivity and potential to prevent deadly metastasis, sepsis, stroke, and sickle cell crisis by well‐timed treatment, 5. Moreover, theranostics by integration of PAFC and pulsed photothermal (PT) therapy showed in preclinical studies photomechanical destruction of CTCs, bacteria (Staphylococcus aureus), and infected cells directly in blood flow 3, 4, 5, 6.
In these in vivo methods, especially in the case of rare objects, it is important to know which fraction of the entire blood volume in the organism has been assessed in a certain time, how much time is needed to analyze a desired fraction of the fluid volume, and how often the same circulating cells can return to the detection (treatment) points. As yet (see, e.g., 4, 5, 7, 8) the addressed fraction f A and the measurement time t were related by f A = Qt/V b, with Q being the local volumetric flow rate in the selected vessels and V b the total fluid volume in the organism. While being valid for very short times associated with fractions f A << 1, in general this ignores the fact that the selected vessel usually is a peripheral branch of the entire circulatory system. Furthermore, the above estimation ignores that addressing a certain blood volume more than once does not increase the total treated volume fraction. This leads to a gross underestimation of the required time to reach a given fraction, or an overestimation of the addressed fraction for a given time. Here, we present further analysis of this issue with focus on ultimate detection of a few pathologic cells or disease biomarkers in the entire blood volume, and on blood treatment, for which the volume fraction counts which has been targeted at least once.
We assume a setting in which blood flowing through a vessel is the diagnostic or therapeutic target, and we regard all blood that has perfused the vessel during the time of measurement or therapy as “addressed,” with a volume V A and the other part “non‐addressed,” with volume V NA. Hence the addressed and non‐addressed fractions are f A ≡ V A/V b and f NA = 1 − f A, respectively. For a flow rate Q in the selected vessel, the flow rate of non‐addressed blood is Q NA = f NA Q. Hence, in time interval Δt, the volume of addressed blood V A increases as ΔV A = Q NAΔt = f NA QΔt, and consequently the addressed fraction f A increases with an amount Δf A = ΔV A/V b = f NA QΔt/V b = (1 − f A) QΔt/V b. Now, we make the crucial assumption that the addressed blood will always be uniformly distributed in the vascular system, despite the fact that the observation or therapy is happening locally. This will be justified below. The latter finite difference expression leads to the first‐order differential equation df A/dt = (1 − f A) Q/V b with solution f A = 1 − exp(−Qt/V b). For assessing this in practical situations, we define the fractional volumetric flow rate q ≡ Q/V b (the fraction of the total blood volume flowing through the vessel per unit of time) leading to f A = 1 − exp(−qt).
We analyzed the consequences for a number of practical situations considered in the literature, the result of which is given in Table 1: the mouse tail vein 9, blood vessels in the mouse ear 4, 10, veins and arteries in the human wrist 4, and the human cubital vein 5. For the fractional flow rate values q given in Table 1, the temporal development of the addressed fraction f A is shown in Figure 1. Of the practical situations considered, in the preclinical context the mouse tail vein model provides the most rapid theranostic access to the entire blood volume, though the time needed for assessing 90% of the blood volume is still 6 h. In terms of access speed, single 40–60 μm vessels in the mouse ear form the slowest option, requiring more than 100 h to get access to at least 90% of the blood. For addressing 90% of the blood volume in the large veins and arteries in the human wrist, a time of 40–60 h is needed. The most rapid theranostic access realized until now 5 is the human cubital vein, in which 90% of all blood is addressed in 3 h.
Table 1.
Vessel diameter, average flow speed <V> and total blood volume V b, and the related fractional flow rate q, for a number of situations presented in the literature
Figure 1.
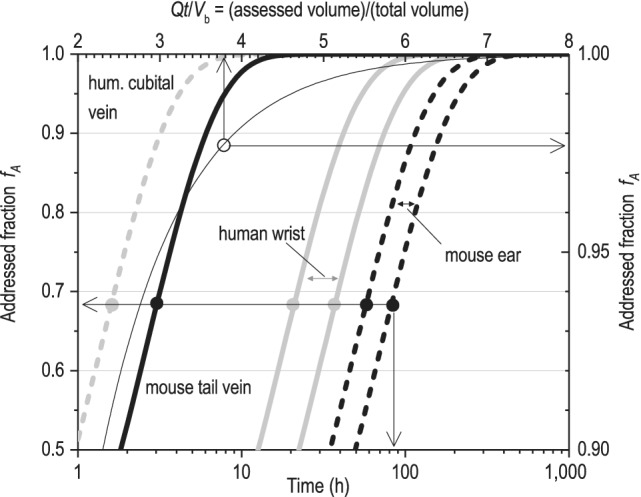
The addressed fraction f A versus time when measuring/treating blood in single vessels, in some previously realized situations, and the addressed fraction f A versus the assessed blood volume normalized with the total blood volume.
All curves in Figure 1 are rescaled versions of each other since they all obey f A = 1 − exp(−qt) with q ≡ Q/V b. Interestingly, qt = Qt/V b represents the temporal development of the volume of blood assessed, normalized with the total blood volume. In Figure 1, a plot is included of the assessed fraction f A as a function of qt, using f A = 1 − exp(−qt). For assessing/treating 99% of the blood, a volume of 4.6× the total blood volume needs to be interrogated. The number of blood volumes that need to pass through the theranostics window to address a certain fraction of the blood qt is universal, hence independent of the total blood volume or the flow rate through the theranostics window.
In developing our simple model a number of assumptions have been made. The most crude assumption, as stated earlier, has been that the addressed blood will always be uniformly distributed in the vascular system, in spite of the fact that the observation or therapy is happening locally. This is equivalent to stating that the treated or observed fluid is immediately redistributed over the entire vascular system, effectively ignoring the circulation time. In our derivation, no explicit assumption has been made that a measurement is performed in a peripheral branch: only a certain flow through the vessel was assumed, being a certain fraction of the cardiac output. In the extreme situation that this fraction equals one, hence the observation window is in the ascending aorta upstream of the first branch, or in the pulmonary artery, or when the vascular system is (hypothetically) a simple single loop, we would expect f A to increase linearly from 0 to 1 as soon as the observation or treatment is starting. This linear relation is obviously no solution of the derived differential equation. The expression Δf A = (1 − f A) QΔt/V b only holds for situations in which observed/treated fluid instantaneously presents itself in the new fraction f A at the treatment window. This approach will be valid if the time scale at which the newly treated fraction is mixed with the untreated blood is much shorter than the typical time scale at which f A increases. This mixing is realized in a few roundtrips of the blood. Comparison of the typical circulation time in the mouse of 15 s 11, and a circulation time of 1 min in humans (based on a cardiac output of 300 l/h and a total blood volume of 5 l in an adult human), with the time scale of hours at which f A increases in both humans and mice (see Fig. 1), learns that our model is likely to hold when addressing well accessible peripheral vessels.
Another assumption is that the geometrical details of trajectories of consecutive round‐trips through the circulatory system are uncorrelated: whether or not cells or particles will enter the peripheral vessel is independent of past events. In view of the complexity of the vascular system, this is a fair assumption. Basically, this concept is more or less included in the previous assumption of rapid mixing.
Another assumption has been that all the blood, or all the objects of interest in the blood, have effectively been observed (in a diagnostic context) or treated (in a therapeutic context) when flowing once through the interrogated vessel. Deviations from this condition can be accounted for in a efficiency parameter η (0 < η < 1) leading to f A = 1 − exp(−ηqt). Here, we have assumed η = 1 while in practice lower values will be obtained. In PT theranostics, this will depend on the beam size related to the blood vessel size, the optical extinction rate of the interrogated fluid, and the local optical fluence, while also the potential nonlinear character of the theranostics interaction may play a role. In that case, the model can be adapted by only considering the flow in the interrogated part of the vessel, optionally combined with the use of a position dependent efficiency parameter η(x,y,z).
Finally, we have treated objects as small tracer particles being passively transported with the blood, hence with an equal probability to be found anywhere in the fluid. This will break down for particles having a preference for occupying a certain region of the blood vessels, for example, for erythrocytes which tend to migrate away from the vessel wall (the Fahraeus‐Lindquist effect 12), or leukocytes and potentially CTCs rolling over the vessel wall. In such cases, the model may be modified by replacing volumetric blood flow rate with particle flux.
An important next step in the development and refinement of our model will be to implement an in silico animal model in which the essentials of blood circulation and the theranostic method are implemented. This computational model can be used for validating the model presented here, and for investigation of its limits of validity.
Our model shows that theranostics with guidance by in vivo flow cytometry in very superficial vessels may lead to procedure times of 10s of hours in humans, and more than 100 h in mice if 90% of the blood is to be addressed. More practically feasible procedure times of several hours are obtained in larger vessels such as the mouse tail vein, mouse carotid artery or mouse jugular vein, or the human cubital vein. We emphasize that for cell counting much shorter times apply, e.g. minutes, depending on the concentration of circulating objects such as circulating tumor cells [5].
The assessment of larger blood vessels in humans with diameters of 5–10 mm such as the carotid artery of jugular vein with flow velocity of 7–15 cm/s will allow to further reduce monitoring and treatment time to less than 1 h. However, the larger depth of these vessels and the maintenance of a large theranostics efficiency will pose a major challenge.
Acknowledgments
This work was supported in part by the NSF grants OIA 1457888 and DBI 1556068 and by RF grant 14Z50.31.0044 (grants VZ).
References
- 1. Galanzha EI, Zharov VP. Circulating tumor cell detection and capture by photoacoustic flow cytometry in vivo and ex vivo. Cancer 2013;5:1691–1738. [DOI] [PMC free article] [PubMed] [Google Scholar]
- 2. Hartmann C, Patil R, Lin CP, Niedre M. Fluorescence detection, enumeration and characterization of single circulating cells in vivo: Technology, applications and future prospects. Phys Med Biol 2018;63 10.1088/1361-6560/aa98f9 [DOI] [PMC free article] [PubMed] [Google Scholar]
- 3. Kim JW, Galanzha EI, Zaharoff DA, Griffin RJ, Zharov VP. Nanotheranostics of circulating tumor cells, infections and other pathological features in vivo. Mol Pharm 2013;10:813–830. [DOI] [PMC free article] [PubMed] [Google Scholar]
- 4. Menyaev YA, Carey KA, Nedosekin DA, Sarimollaoglu M, Galanzha EI, Stumhofer JS, Zharov VP. Preclinical photoacoustic models: Application for ultrasensitive single cell malaria diagnosis in large vein and artery. Biomed Opt Express 2016;7:3643–3658. [DOI] [PMC free article] [PubMed] [Google Scholar]
- 5. Galanzha EI, Menyaev YA, Yadem AC, Sarimollaoglu M, Juratli MA, Nedosekin DA, Foster SR, Jamshidi‐Parsian A, Siegel ER, Makhoul I, et al. In vivo liquid biopsy using Cytophone platform for photoacoustic detection of circulating tumor cells in patients with melanoma. Sci Trans Med 2019;11:eaat5857. [DOI] [PMC free article] [PubMed] [Google Scholar]
- 6. He Y, Wang LD, Shi JH, Yao JJ, Li L, Zhang RY, Huang CH, Zou J, Wang LHV. In vivo label‐free photoacoustic flow cytography and on‐the‐spot laser killing of single circulating melanoma cells. Sci Rep 2016;6 10.1038/srep39616 [DOI] [PMC free article] [PubMed] [Google Scholar]
- 7. He W, Wang HF, Hartmann LC, Cheng JX, Low PS. In vivo quantitation of rare circulating tumor cells by multiphoton intravital flow cytometry. Proc Natl Acad Sci USA 2007;104:11760–11765. [DOI] [PMC free article] [PubMed] [Google Scholar]
- 8. Tan XF, Patil R, Bartosik P, Runnels JM, Lin CP, Niedre M. In vivo flow cytometry of extremely rare circulating cells. Sci Rep 2019;9:3366. [DOI] [PMC free article] [PubMed] [Google Scholar]
- 9. Pera V, Tan XF, Runnels J, Sardesai N, Lin CP, Niedre M. Diffuse fluorescence fiber probe for in vivo detection of circulating cells. J Biomed Opt 2017;22 10.1117/1.JBO.22.3.037004 [DOI] [PMC free article] [PubMed] [Google Scholar]
- 10. Cai CZ, Carey KA, Nedosekin DA, Menyaev YA, Sarimollaoglu M, Galanzha EI, Stumhofer JS, Zharov VP. In vivo photoacoustic flow cytometry for early malaria diagnosis. Cytometry A 2016;89A:531–542. [DOI] [PubMed] [Google Scholar]
- 11. Debbage PL, Griebel J, Ried M, Gneiting T, DeVries A, Hutzler P. Lectin intravital perfusion studies in tumor‐bearing mice: Micrometer‐resolution, wide‐area mapping of microvascular labeling, distinguishing efficiently and inefficiently perfused microregions in the tumor. J Histochem Cytochem 1998;46:627–639. [DOI] [PubMed] [Google Scholar]
- 12. Fahraeus R, Lindqvist T. The viscosity of the blood in narrow capillary tubes. Am J Physiol 1931;96:562–568. [Google Scholar]