
Figure 5.
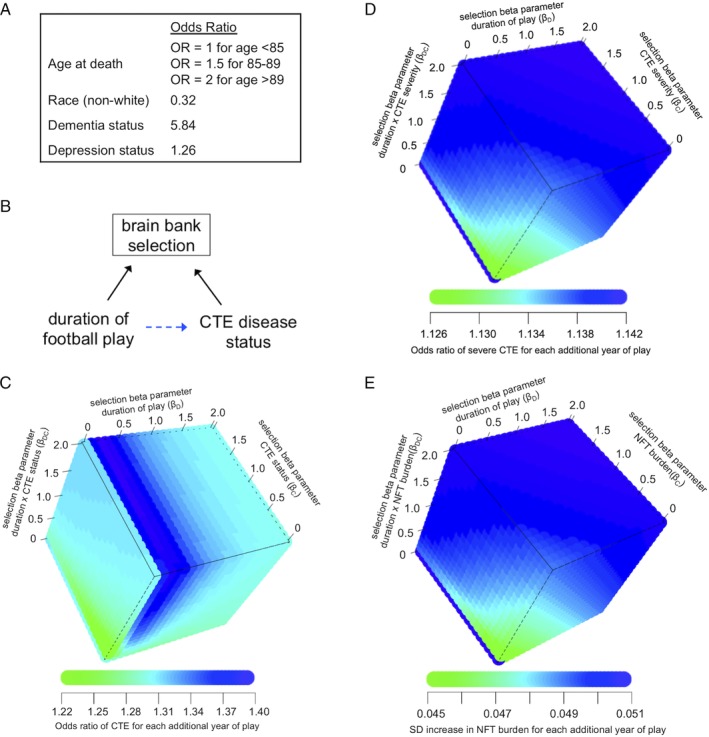
Evaluating selection bias. (A) Factors and their associations with the relative odds of brain donation status from a community‐based aging cohort that were included in the selection model (adapted from Haneuse et al12). Both education level and sex also predicted brain donation, but were excluded from the selection model because there were no women in this study and because education quality differs markedly for college and professional football players. OR = odds ratio. (B) Simplified directed acyclic graph demonstrating the relationship between duration of American football play, chronic traumatic encephalopathy (CTE) pathology, and brain bank selection. Brain bank selection will only bias the relationship between duration of American football play and CTE pathology (dotted blue arrow) if both duration played (or a cause of duration played) and CTE pathology (or a cause of CTE pathology) are related to brain bank selection. (C) Simulation analyses assessed how a range of non‐negative values for selection parameters for duration played (βD, ie, log odds of brain donation for each additional year played when CTE pathology is absent), CTE disease status (βC, ie, log odds of brain donation when CTE pathology is present compared with absent when duration played is approaching zero), and the duration played × CTE status cross product (βDC, ie, additional log odds of brain donation for each additional year played beyond βD, when CTE pathology is present) would affect the odds ratio for the relationship between duration played and CTE disease status. (D, E) Similar simulation analyses assessed how a range of non‐negative values for selection parameters would affect (D) the odds ratio for the relationship between duration played and CTE severity, and (E) the relationship between duration played and neurofibrillary tangle (NFT) burden. SD = standard deviation.