
Figure 3.
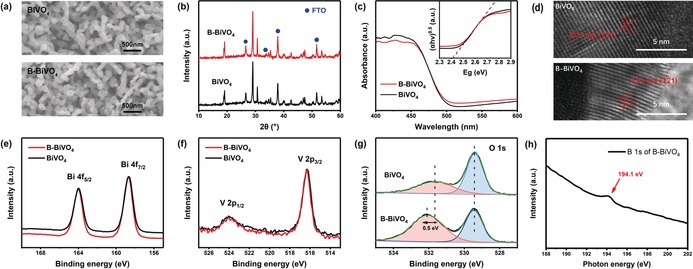
a) SEM images, b) X‐ray diffraction (XRD) spectra, and c) UV/Vis diffuse spectra of BiVO4 and B‐BiVO4 photoanodes. Inset: Tauc plots of BiVO4 and B‐BiVO4. d) HRTEM images of the bare BiVO4 and B‐BiVO4 photoanodes, respectively. e) Bi 4f, f) V 2p, and g) O 1s XPS spectra for bare BiVO4 and B‐BiVO4 photoanodes, respectively. h) B 1 s NEXAFS edge spectrum for the B‐treated BiVO4 sample.