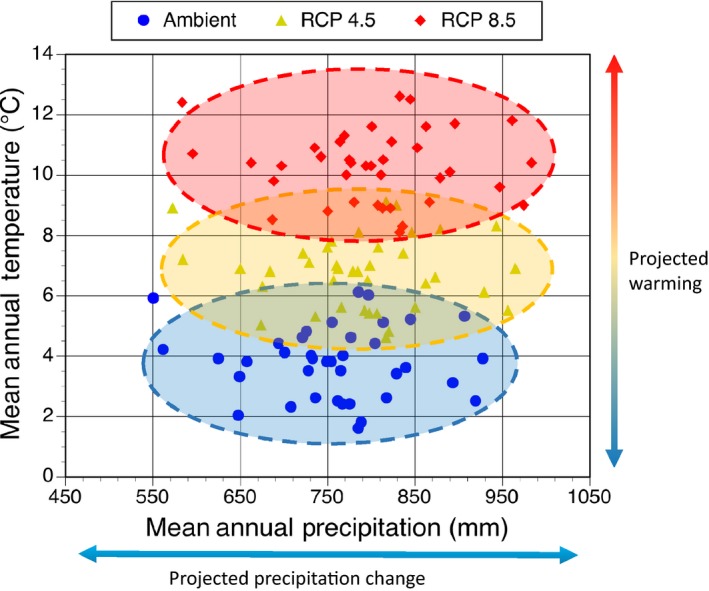
Figure 3.

An example of historical and projected climate space (mean annual precipitation vs. mean annual temperatures) for a 50 year record in the eastern United States showing limited overlap between the known temperature record and projected temperature futures under a range of forcing scenarios. The temperature and precipitation projections are based on the model‐mean differential from IPCC (IPCC, 2013: Annex I) for RCP 4.5 and RCP 8.5 for the eastern United States region
