Figure 9.

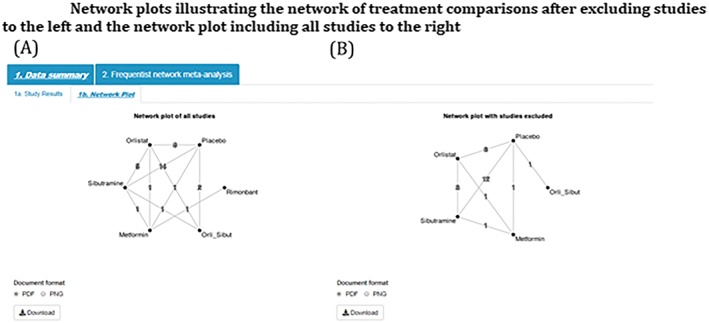
Network plots illustrating the network of treatment comparisons after excluding studies to the left and the network plot including all studies to the right [Colour figure can be viewed at http://wileyonlinelibrary.com]

Network plots illustrating the network of treatment comparisons after excluding studies to the left and the network plot including all studies to the right [Colour figure can be viewed at http://wileyonlinelibrary.com]