Figure 3.

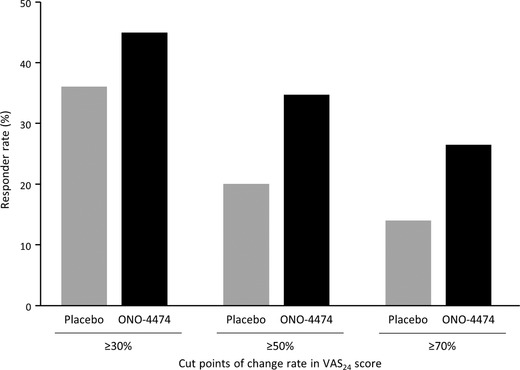
Treatment response rates at week 4. Responder rates are shown according to number of patients with VAS24 scores ≥30%, ≥50%, and ≥70% below baseline. VAS24, visual analog scale over 24 hours.

Treatment response rates at week 4. Responder rates are shown according to number of patients with VAS24 scores ≥30%, ≥50%, and ≥70% below baseline. VAS24, visual analog scale over 24 hours.