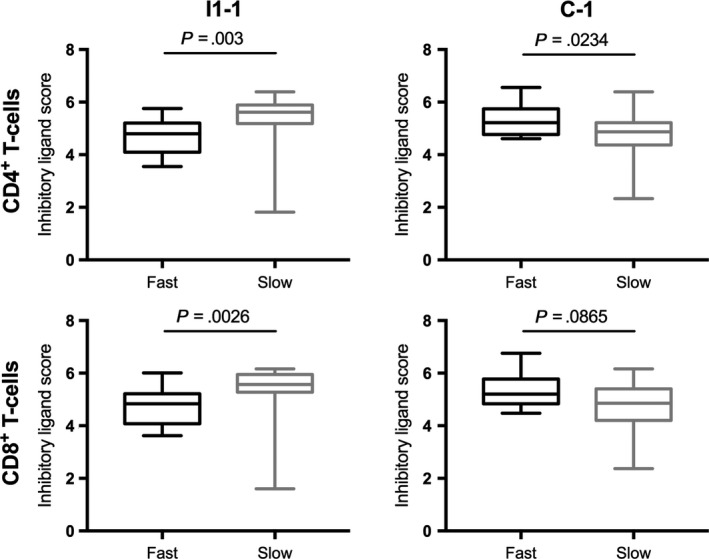
Figure 4.

Inhibitory ligand expression at baseline differs significantly between CD4+ T cells of fast and slow responders. Inhibitory profiles were generated for each individual by combining z‐scores of CTLA‐4, TIM‐3, and PD‐1 at each time point. Inhibitory profiles of slow responders CD4+ cells were significantly higher prior to the first immunization (I1‐1). In contrast, inhibitory profiles of slow responders’ CD4+ and CD8+ T cells were significantly lower by the end of immunization (C‐1), while fast responders’ inhibitory profiles increased. Mann‐Whitney U test was used to calculate significance
