
. 2019 Apr 1;127(2):275–284. doi: 10.1111/1471-0528.15675
© 2019 The Authors. BJOG: An International Journal of Obstetrics and Gynaecology published by John Wiley & Sons Ltd on behalf of Royal College of Obstetricians and Gynaecologists
This is an open access article under the terms of the http://creativecommons.org/licenses/by-nc/4.0/ License, which permits use, distribution and reproduction in any medium, provided the original work is properly cited and is not used for commercial purposes.
Figure 1.
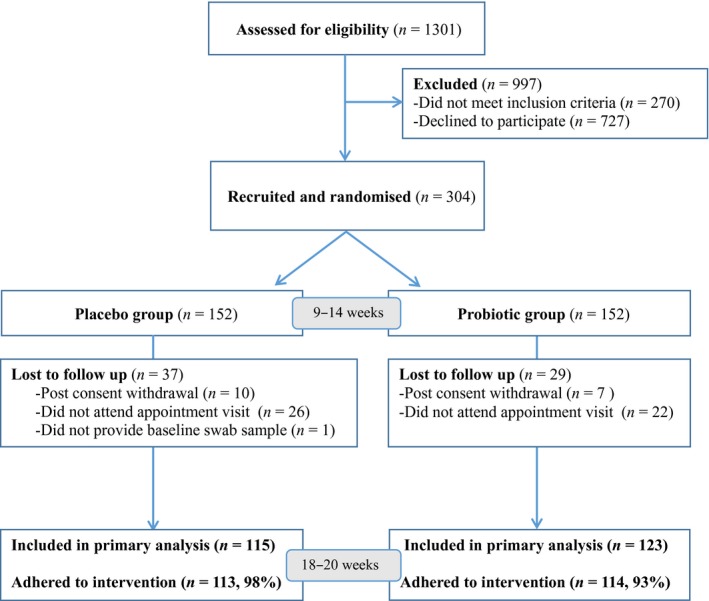
Flow chart showing numbers of participants at each stage of the trial.