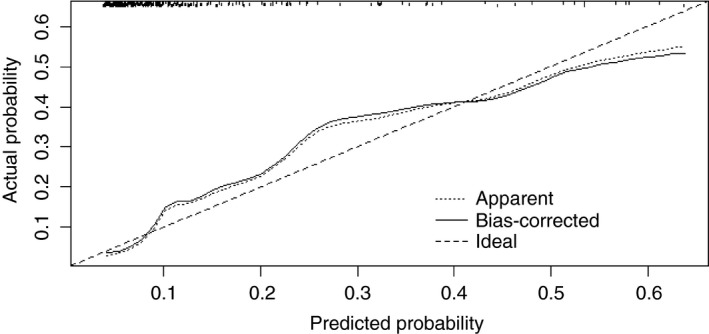
Figure 2.

Calibration plot for nomogram predicting anastomotic leakage with serum C‐reactive protein and peritoneal matrix metalloproteinase 9 on postoperative day 3. This plot represents the relationship between predicted probability from the nomogram and observed probability in the dataset. The bootstrap method was used to obtain corrected probabilities.
