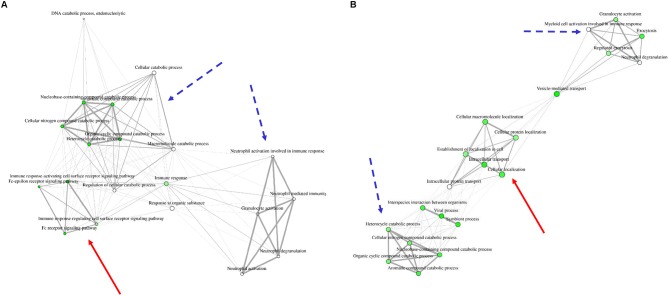
Figure 3.
Network clustering for biological processes to which differentially expressed proteins from IL8 (A) and PMA (B) stimulation were appointed. Three distinct clusters are visible in each stimulation group. Two clusters show similarities between stimulants (dotted blue arrow: granulocyte activation and metabolic processes) whereas one cluster is unique for each group [red arrow: immune response signaling pathways in IL8 stimulated cells (A) and cellular protein localization in PMA stimulated cells (B)]. For a more clear presentation of clusters, we searched 20 most significant categories instead of 30.

