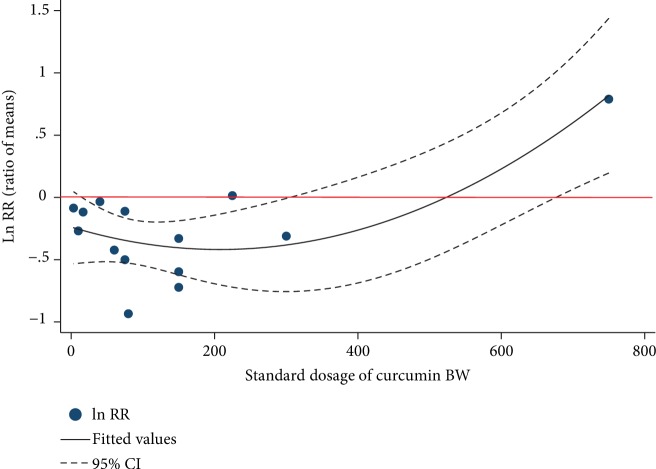
Figure 6.
Nonlinear dose-response relationship between Napierian logarithm of RR and the intake of curcumin. The red line represents an invalid effect. The area between the dash lines represents the 95% CI. Dots represent each of the studies. RR: ratio of means, equal to meansexperimental/meanscontrol.

