. 2019 Dec 20;28(1):55–64. doi: 10.1002/oby.22640
© 2019 The Obesity Society (TOS). This article has been contributed to by US Government employees and their work is in the public domain in the USA.
This is an open access article under the terms of the http://creativecommons.org/licenses/by-nc/4.0/ License, which permits use, distribution and reproduction in any medium, provided the original work is properly cited and is not used for commercial purposes.
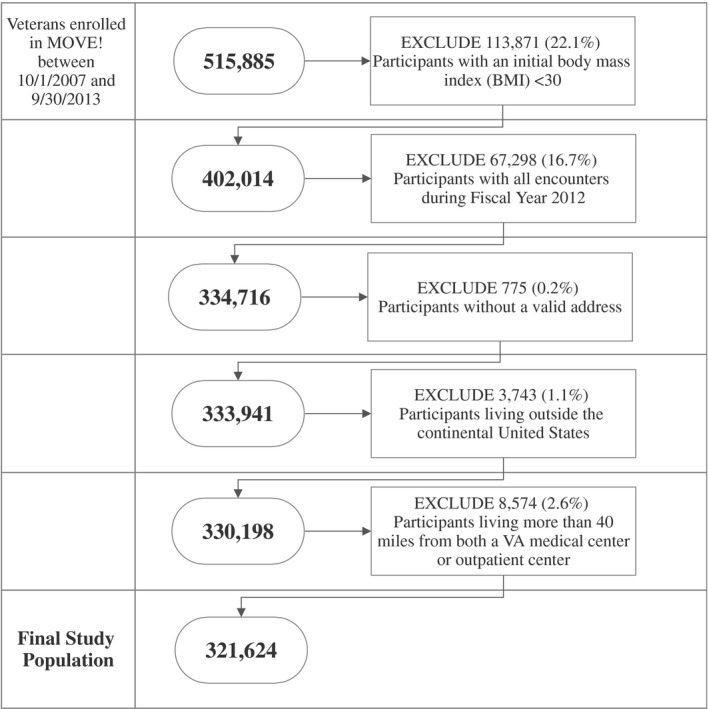
Figure 1.

Study population flowchart.
