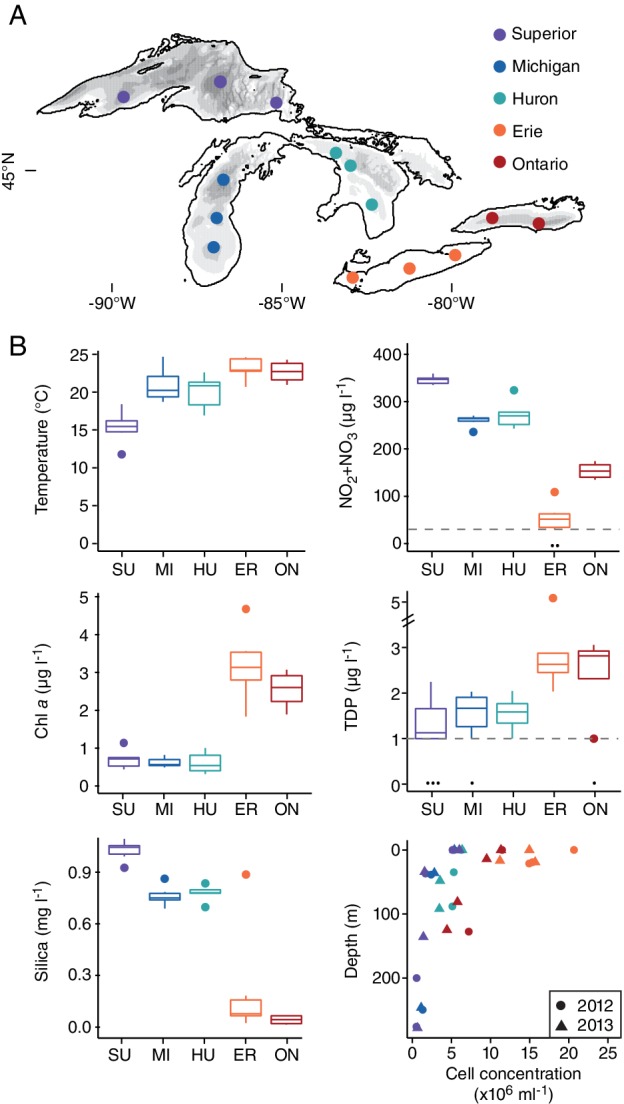
Figure 1.

The Laurentian Great Lakes study system. A. Map of the lakes with grayscale illustrating depths from <100 m to >300 m. Points coloured by lake indicate the locations of sampling stations. B. Physicochemical parameters and bacterial cell counts across lakes. Temperature, chlorophyll a (chl a), dissolved SiO3/SiO4 as Si, nitrite plus nitrate (NO2 − + NO3 −) and total dissolved phosphorus (TDP) are shown for all surface samples in 2012 and 2013 (average ± SE; data from US EPA Great Lakes Environmental Database). For N and P, black dots near the x‐axis indicate concentrations below the detection limit, which is indicated by a grey dashed line. These values were set to the detection limit for calculating mean/SE. Microbial cell concentrations as a function of depth are provided for one master station per lake (indicated in Table S1) in 2012 and 2013. Box plots and scatter points are colour coded by the lake.
