
Figure 3.
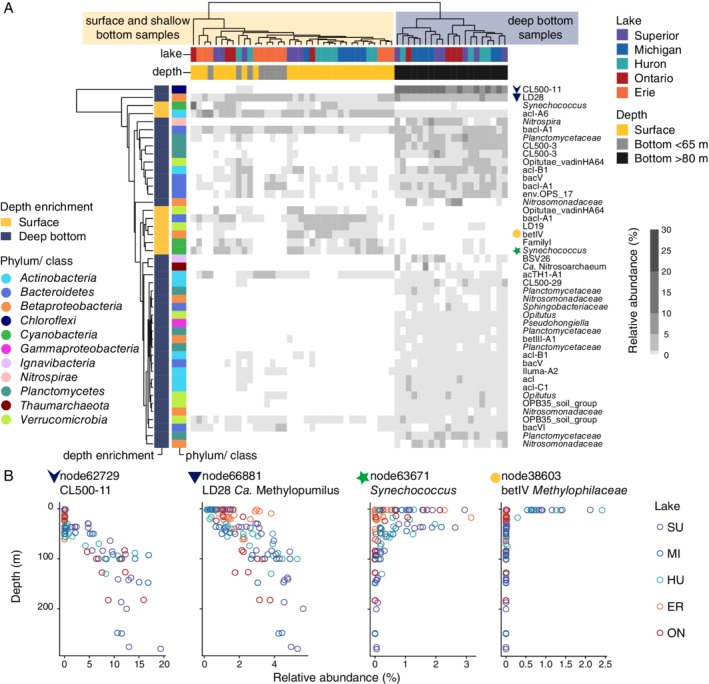
Depth‐stratified oligotypes exhibited a range of distribution patterns and included many deep‐water specialists. A. Heat map showing relative abundance of abundant oligotypes with significant depth enrichment, based on a Wald test comparing log2 fold change with p < 10−6. Dendrograms depict complete‐linkage clustering among samples and oligotypes, grouping together samples with similar oligotype composition and oligotypes with similar distributions across samples. B. Example depth distributions of four oligotypes during summer stratification: Chloroflexi Anaerolineaceae node62729, Ca. Methylopumilus LD28 node66881, Cyanobacteria Synechococcus node63671 and Methylophilaceae betIV node38603.