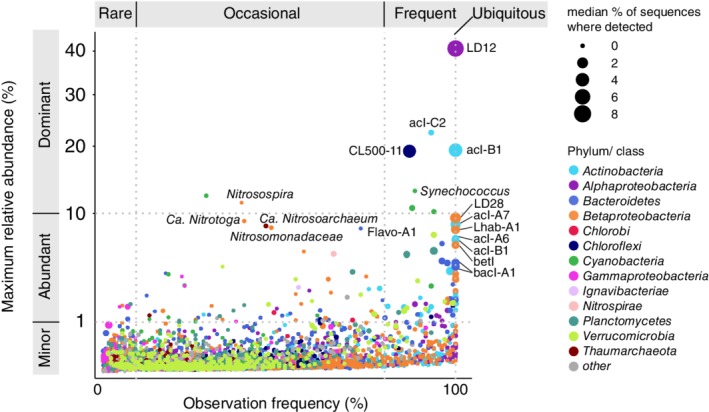
Figure 5.

Maximum relative abundance of each oligotype as a function of the percent of samples where that oligotype was detected. Oligotypes are colour‐coded by phylum. Included in this analysis are samples collected in spring and summer from surface, deep chlorophyll layer (summer, if present), mid‐hypolimnion (summer) and bottom depths. See Fig. S7 for this analysis carried out separately for specific sets of samples. Symbol size corresponds to the median proportion of sequences for each oligotype (when detected).
