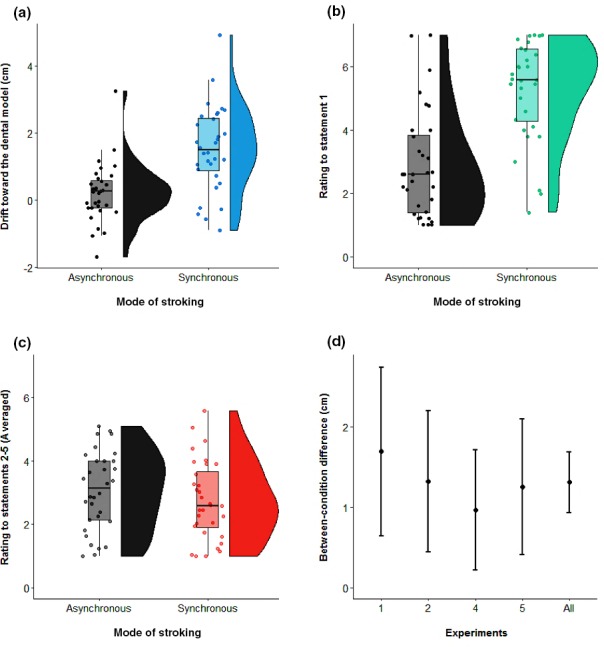
Figure 7.

Raincloud plot (Allen, Poggiali, Whitaker, Marshall, & Kievit, 2018) of the pooled data across experiments (N = 32), for the two stroking conditions: asynchronous and synchronous. Each single‐subject value corresponds to the proprioceptive drift towards the dental model (in cm). Positive values correspond to a drift in the perceived position of the maxillary incisor towards the dental model. The half violin plot depicts the probability density of the data at different values and contains 95% confidence intervals of the mean for the two conditions (a). Raincloud plot of the pooled data across experiments (N = 32), for the two stroking conditions: asynchronous and synchronous. Each single‐subject value corresponds to the rating to the first statement of the DMI questionnaire. The half violin plot depicts the probability density of the data at different values and contains 95% confidence intervals of the mean for the two conditions (b). Raincloud plot of the pooled data across experiments (N = 32), for the two stroking conditions: asynchronous and synchronous. Each single‐subject value corresponds to the pooled rating of statements 2–5 of the DMI questionnaire. The half violin plot depicts the probability density of the data at different values and contains 95% confidence intervals of the mean for the two conditions (c). 95% confidence intervals of the difference between the two stroking conditions. Positive values correspond to a larger DMI effect for synchronous vs. asynchronous stroking condition. The differential DMI stroking effect is plotted for each experiment (N = 8), as well as the pooled data across experiments (N = 32). [Colour figure can be viewed at http://www.wileyonlinelibrary.com]
