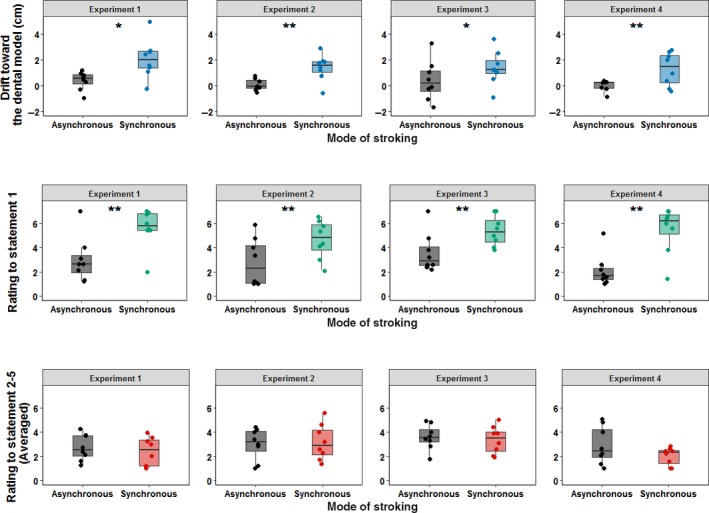
Figure 8.

2 × 3 pooled ANOVAs computed with stroking as within‐subject factor and experiment as a between‐subject factor on the proprioceptive drift (a) on the rating given to the first statement of the DMI questionnaire (b) and on the pooled rating of statements 2–5 (c). Each single‐subject value corresponds to the proprioceptive drift towards the dental model (in cm) (a) and to the rating to the given DMI questionnaire's statement (b and c). In all the box plots, lower and upper box boundaries represent 25th and 75th percentiles, respectively, and the line inside box shows the median. *p < .05, **p < .01. [Colour figure can be viewed at http://www.wileyonlinelibrary.com]
