
Figure 3.
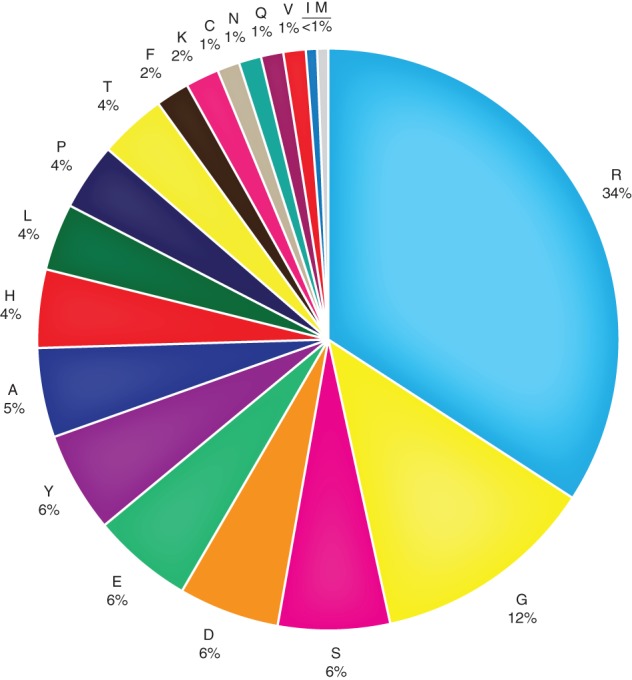
Distribution of amino acids encoded by hotspot mutational targets. The data summarize all the hotspot mutational targets identified in Table S4. The figure presents the distribution of amino acids encoded by hotspot mutational targets observed across all 10 cancer types. Distributions for individual cancer types are provided in Figure S1.