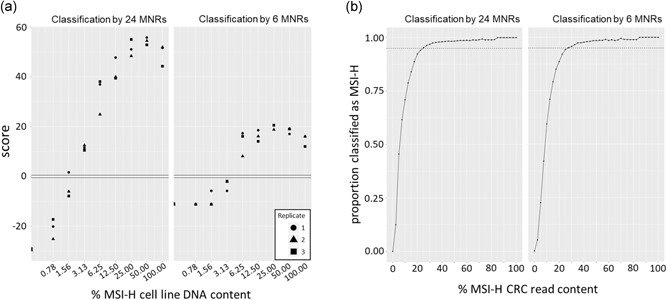
Figure 2.

Assay robustness to sample heterogeneity. A, Classifier scores from mixtures of MSI‐H cell line and MSS PBL DNA samples. B, The proportion of correctly classified samples from 2400 simulated mixture series from the validation cohort reads (dotted line = 0.95). CRC, colorectal cancer; MNR, mononucleotide repeat; MSS, microsatellite stable; MSI‐H, high levels of MSI; PBL, peripheral blood leukocyte
