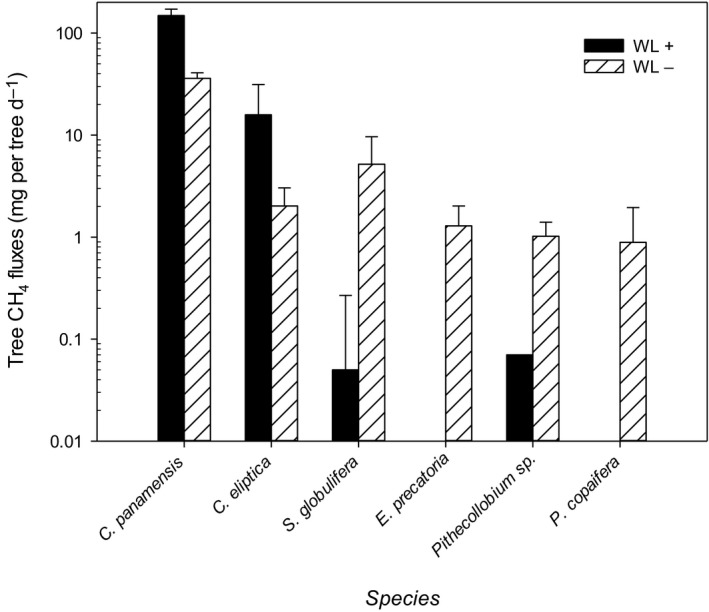
Figure 3.

Tree CH 4 emissions from the six target species integrated to the tree level. Black bars are measurements made when the water table was above the peat surface (WL+) adjacent to the individual tree, while grey bars refer to water tables below the peat surface (WL−). For some locations/trees the water table was always below the peat surface (i.e. there are no black bars for Euterpe precatoria or Prioria copaifera). Means ± SE are shown (n = 32). Note that only one measurement at high water tables was made for Pithecollobium.
