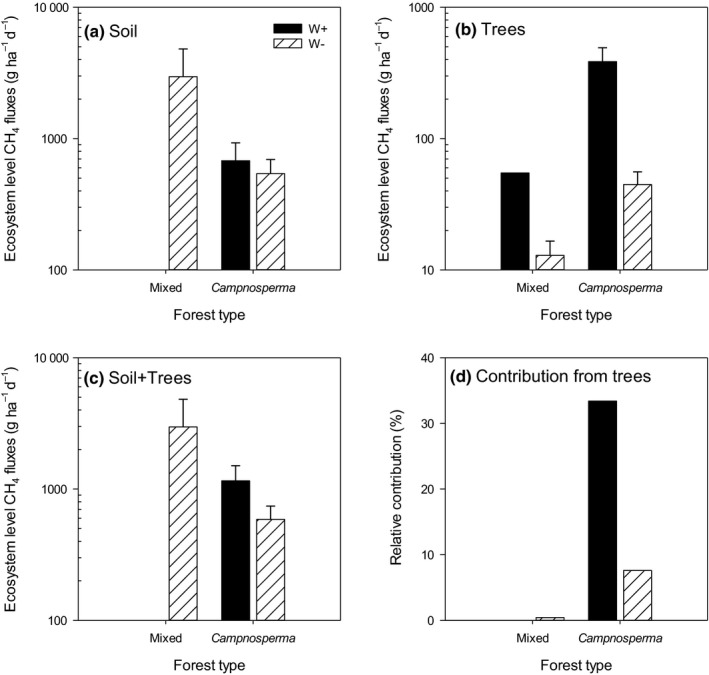
Figure 5.

Methane fluxes from (a) soil and (b) trees, (c) net ecosystem fluxes, and (d) relative contribution from trees at mixed and Campnosperma forests. Black bars are measurements made when the water table was above the peat surface (WL+) adjacent to the individual tree, while striped bars refer to water tables below the peat surface (WL−). Note the different scale between soil and tree fluxes. Means ± SE are shown.
