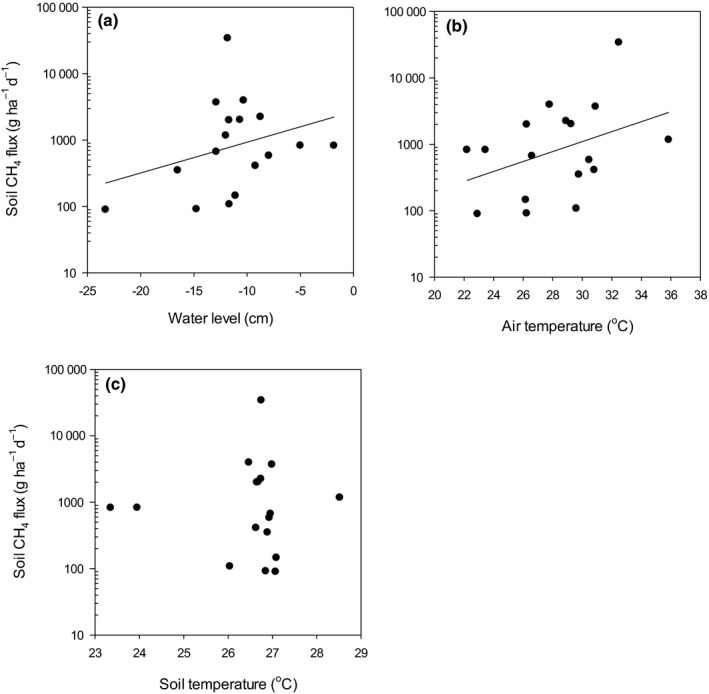
Figure 6.

Relationship between the mixed forest site CH 4 fluxes from the peat surface and (a) water levels (positive values indicate water levels above the peat surface), (b) air temperature and (c) soil temperature. Significant single linear regression lines are plotted; the models are reported in Table 3.
