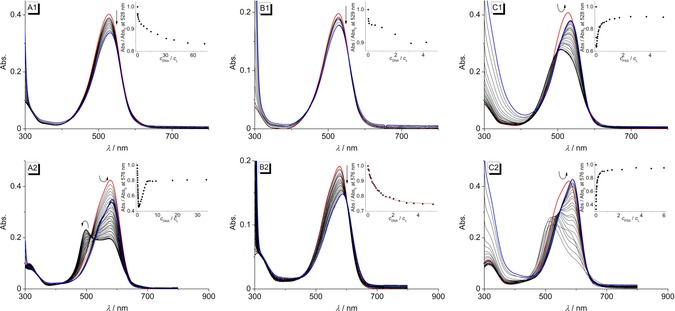
Figure 4.

Spectrophotometric titration of 7 b (1) and 8 b (2) with ct DNA [A, c L=10 μm, c DNA=2.17 mm (A1), c DNA=1.49 mm (A2); c DNA in base pairs] in BPE buffer (c Na+=16 mm, pH 7.0; with 5 % v/v DMSO), 22AG (B, c L=5 μm, c 22AG=285 μm; c 22AG in oligonucleotide) in K‐phosphate buffer pH 7.0 (c K+=73 mm; with 5 % v/v DMSO) and PSS [C, c L=10 μm, c PSS=190 μm (C1), c PSS=195 μm (C2)] in BPE buffer (c Na+=16 mm, pH 7.0; with 2.5–5 % v/v DMSO). Red: Spectra of the pure ligand solutions; blue: spectra at the end of the titrations. The arrows indicate the changes of absorption upon addition of the host molecule. Insets: Plot of Abs./ Abs.0 versus c DNA/c L or c PSS/c L.
